QTLbase Usage Documentation Introduction Terminology in QTLbase QTL studies collection, filtering and processing Database usage Variant Annotation Comparison ViewerNew Linkage Disequilibrium (LD) ViewerNew Associated GenesNew Whole-genome sequencing (WGS) QTLsNew Filter xQTL by biological conditionsNew Download
Introduction
Exploiting genotype–phenotype causality will facilitate an in-depth understanding of the genetic basis of complex traits. Recent advances in genome sequencing and functional genomic profiling have promoted many large-scale quantitative trait locus (QTL) studies, which connect genotypes with tissue/cell type-specific cellular functions (i.e., molecular traits quantified by various high-throughput profiles) in different biological stages. QTLbase is curating and compiling genome-wide QTL summary statistics for human molecular traits across >70 tissue/cell types. QTLbase allows users to query, compare, and visualize QTLs at tissue-wise, phenome-wise, and variant-wise levels. QTLbase also incorporates large-scale tissue/cell type-specific genomic features and functional annotations to interpret the underlying QTL mechanisms. Overall, QTLbase provides a one-stop shop for QTL retrieval and comparison across multiple tissues and multiple layers of molecular complexity, and will greatly help researchers interrogate the biological mechanism of causal variants and guide the direction of functional validation.
Molecular traits incorporated in the current version of QTLbase include:
| Molecular trait | QTL | Description |
|---|---|---|
| gene expression | eQTL | expression quantitative trait locus |
| DNA methylation | mQTL | methylation quantitative trait locus |
| histone modification | hQTL | histone modification quantitative trait locus |
| splicing event | sQTL | splicing quantitative trait locus |
| protein expression | pQTL | protein quantitative trait locus |
| chromatin accessibility | caQTL | chromatin accessibility quantitative trait locus |
| RNA editing | edQTL | RNA editing quantitative trait locus |
| microRNA expression | miQTL | microRNA expression quantitative trait locus |
| competing endogenous RNA expression | cerQTL | competing endogenous RNA expression quantitative trait locus |
| ribosome occupancy | riboQTL | ribosome quantitative trait locus |
| cell metabolism | metaQTL | metabolize quantitative trait locus |
| lncRNA expression | lncQTL | lncRNA expression quantitative trait locus |
| enhancer activity | eaQTL | enhancer activity quantitative trait locus |
| promoter usage | puQTL | promoter usage quantitative trait locus |
| transcription factor binding | bQTL | transcription factor binding quantitative trait locus |
| gene expression variance | vQTL | gene expression variance quantitative trait locus |
| mRNA N6-methyladenosine | m6AQTL | mRNA N6-methyladenosine quantitative trait locus |
| circRNA expression | circQTL | circRNA expression quantitative trait locus |
| alternative polyadenylation | apaQTL | alternative polyadenylation quantitative trait locus |
| transcript usage | tuQTL | transcript usage quantitative trait locus |
| promoter interaction expression | pieQTL | promoter interaction expression quantitative trait locu |
| mRNA stability | stQTL | mRNA stability expression quantitative trait locus |
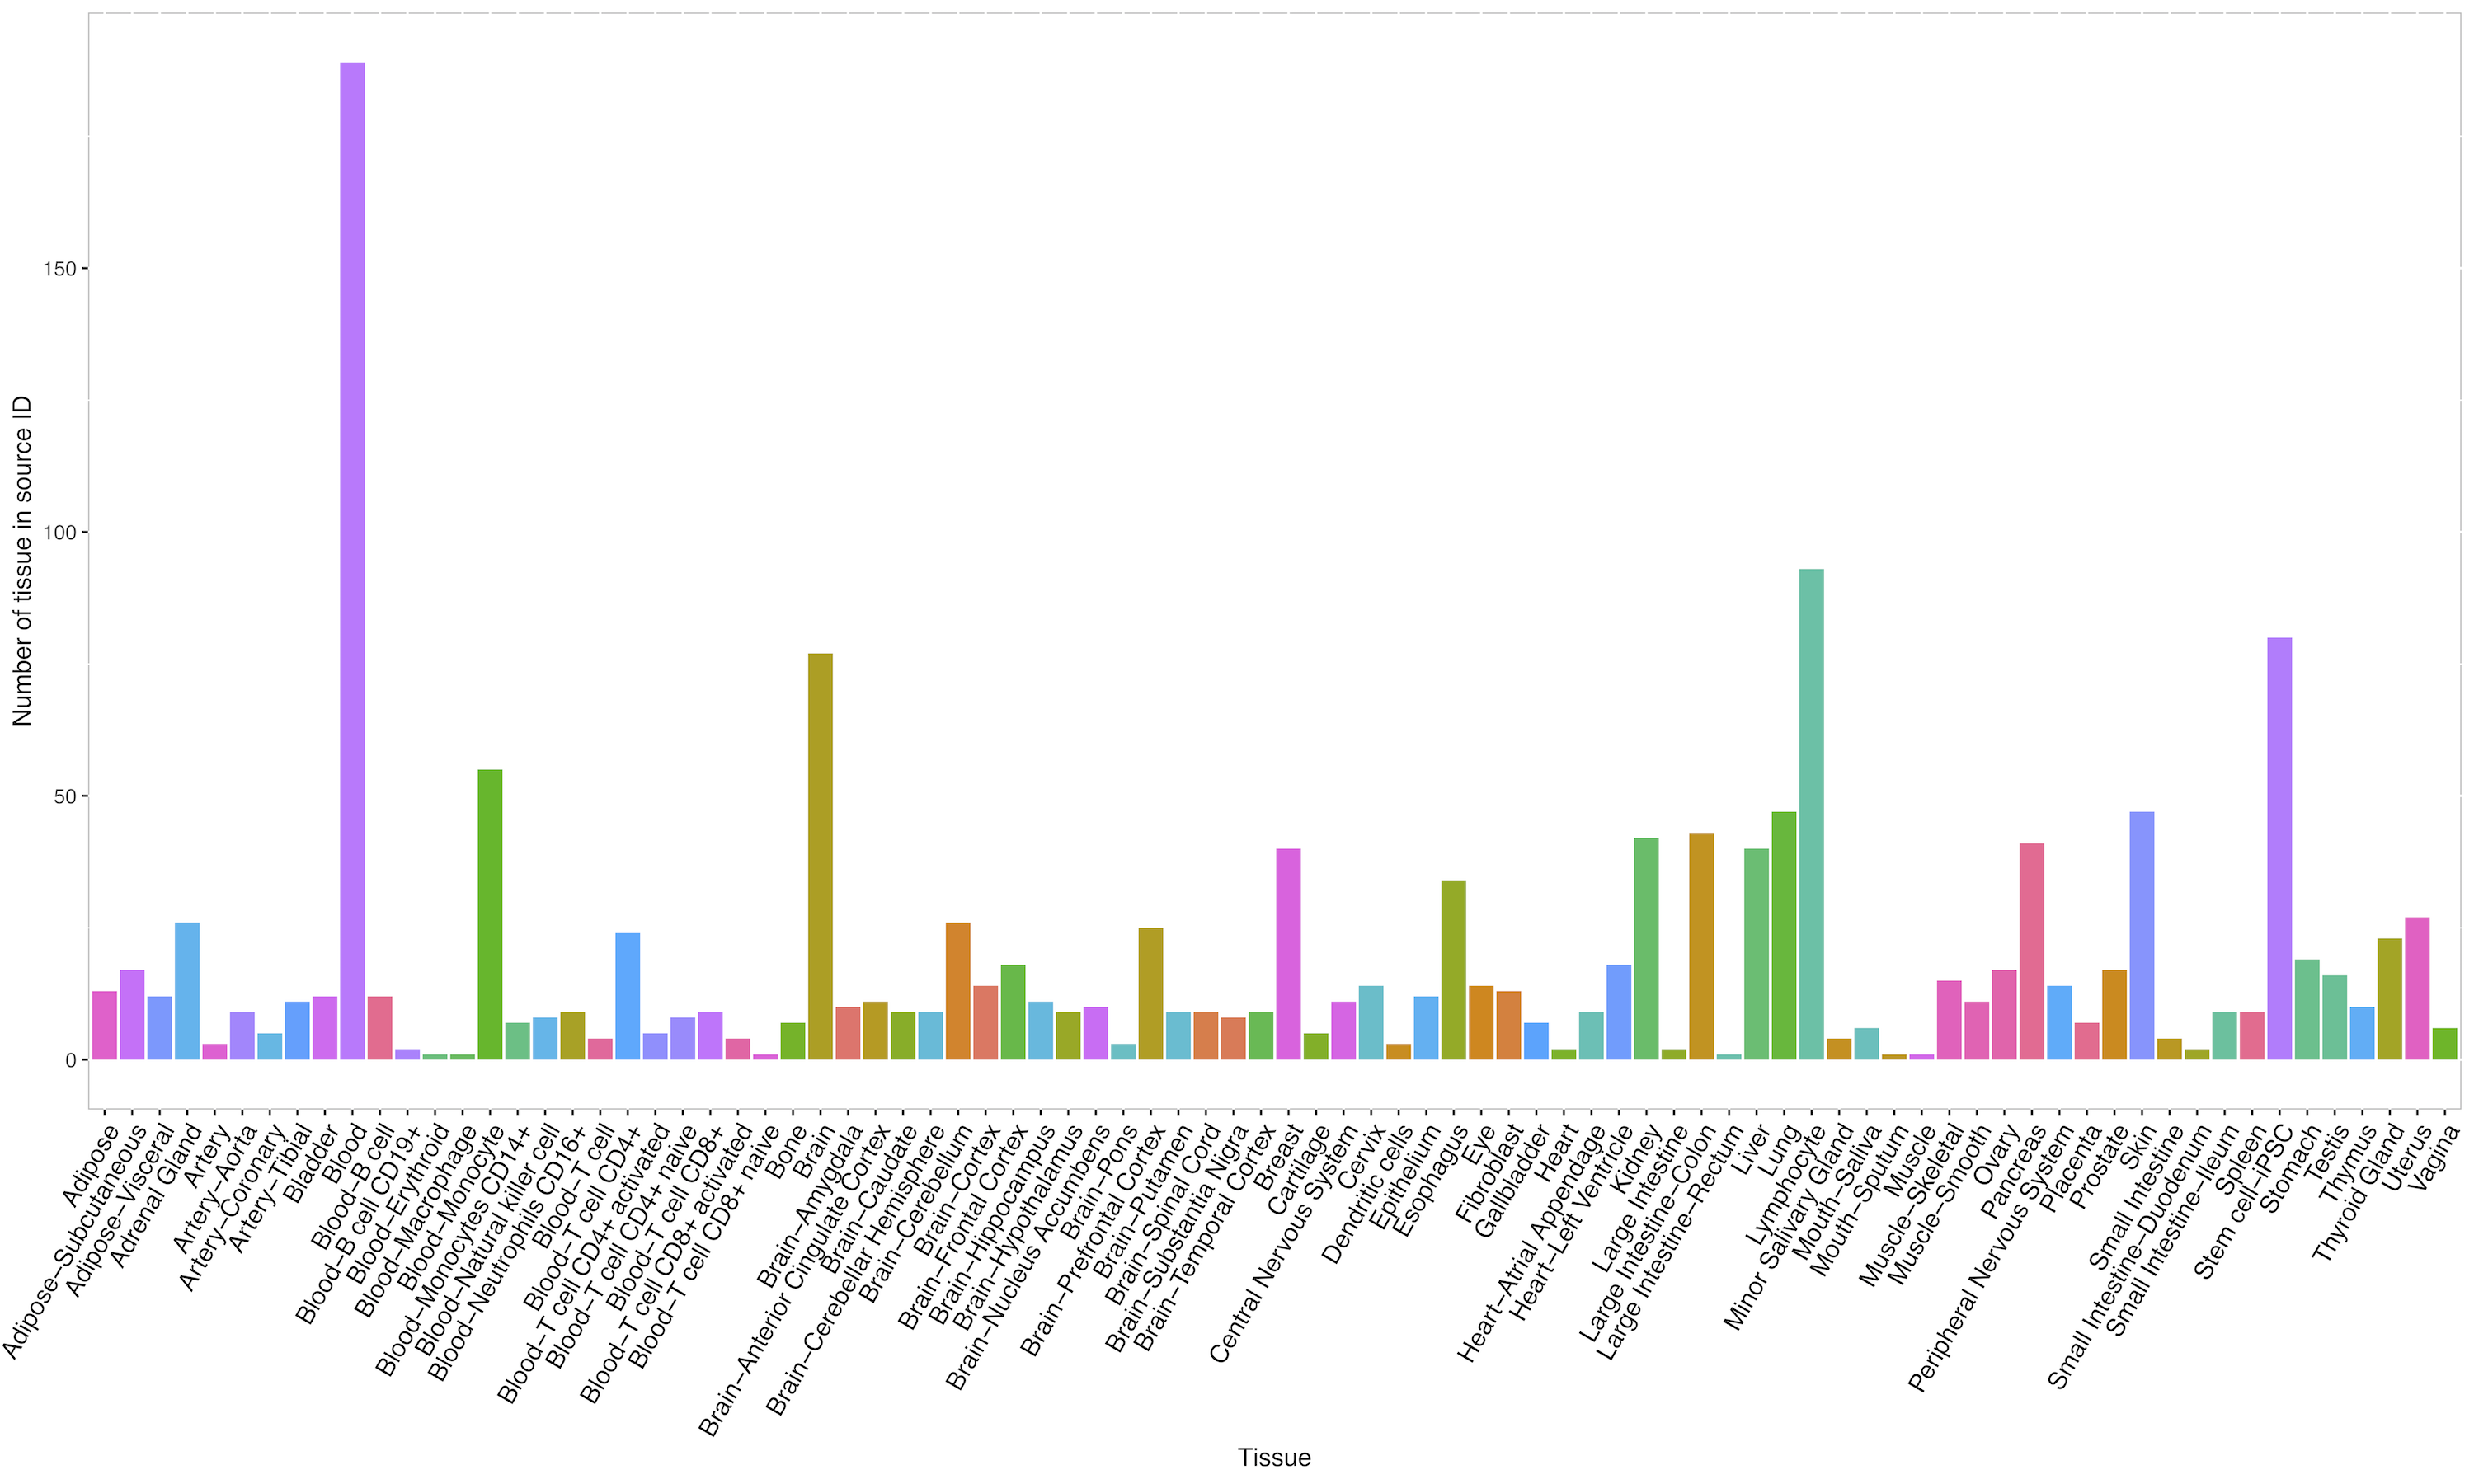
Tissue types and associated study summary information in QTLbase:
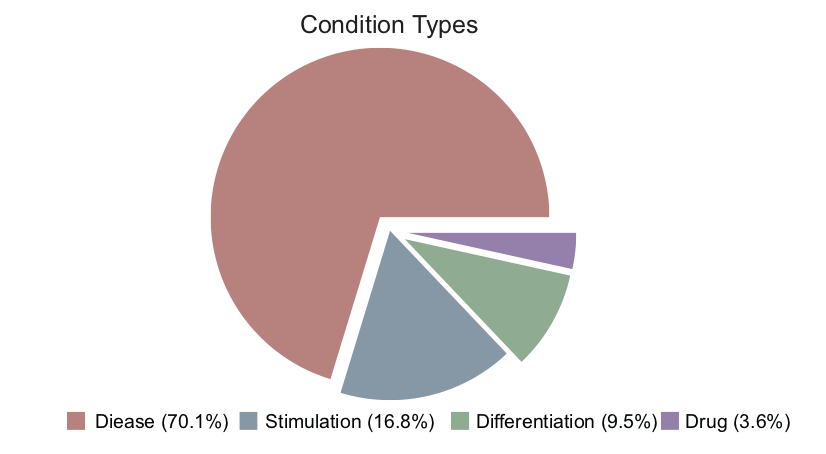
Condition types in QTLbase:
Terminology in QTLbase
- Variant: an alteration in the most common DNA nucleotide sequence; or refers to a genetic variant.
- Quantitative trait locus (QTL): genomic locus (e.g., a genetic variant) which correlates with the variation of a quantitative phenotype of a population of anorganism.
- Molecular trait: a tissue/cell type-specific cellular function that is quantified by a particular assay, such as methylation level, gene expression, and protein expression.
- Trait: usually refers to the phenotype of a population of an organism. In QTLbase, the trait is equivalent to a molecular trait.
- xQTL: genomic locus (e.g., a genetic variant) that explains all or a fraction of variation in certain molecular traits (no matter which trait) is referred to as xQTL.
- QTL mapping: a computational process to identify QTL for a specific trait.
- QTL summary statistics: variant summary information and statistical values generated by QTL mapping, such as variant ID, position, trait name, P-value, effect size, etc.
QTL studies collection, filtering, and processing
1. Resources
We manually curated QTL studies of human molecular phenotypes from the literature by searching PubMed or Google Scholar using QTL-relevant keywords, such as specific xQTL terms, as well as specific descriptions of molecular phenotypes. Data extraction and filtration for QTLbase is a skilled process. The data that meet our collected criteria and pass the filter steps then will be used in the QTLbase backend database and website interfaces. Following are the criteria we collect, filter, and normalize the collected data in QTLbase in brief.
Inclusion criteria
Studies were eligible for inclusion in QTLbase if they met the following criteria:
- Both cis- and trans-QTL studies were included, no matter the molecular traits were studied in normal, treated, or diseased tissue/cell types.
- QTL data from published articles that reported genome-wide primary QTL mapping or meta-analysis.
Studies were excluded if:
- The study was published in non-English language;
- Studies involving the reanalysis of existing QTL data or from specific genomic loci;
- Less informative QTL results, for example, variant, trait, or P-value information were missing.
2. Variant and summary statistics normalization
We collected QTL data from numerous published literature, and some of the data could be very irregular and contain less informative summary statistics. To provide as much as possible information, we filled some information according to the following process.
Variant information normalization
As variant information may have been heterogeneous among the collected QTL data, we synchronized the originally recorded dbSNP IDs with those in dbSNP build 151. For variants where the data only states chromosome position, we first converted them to GRCh37 (Genome Reference Consortium Human Build 37) and GRCh38 (Genome Reference Consortium Human Build 38) position using LiftOver and filled with the corresponding dbSNP ID.
The missing information of variants was completed by the following pipeline:
- rsID : Extracted from dbSNP build 151 according to the position if missing;
- Chromosome and position: Extracted from dbSNP build 151 according to rsID if missing and converted to Human Genome Assembly GRCh37, Human Genome Assembly GRCh38;
- Reference allele: Extracted from dbSNP build 151 if missing;
- Alternative allele: Extracted from dbSNP build 151 if missing.
Mapping trait normalization
Given the complexity of molecular trait description and genomic coordinates recording, we normalized the molecular phenotypes according to different criteria:
- For genes (including long non-coding RNA and small RNA) or transcript phenotypes, such as eQTL and sQTL, we transformed the name or position (if not provided) according to GENCODE Release 30 (GRCh37);
- For phenotypes measured by microarray, such as most mQTLs, we recorded the probe ID as the trait name and the corresponding position described in the chip manifest file;
- For non-gene phenotypes measured by next-generation sequencing (NGS), the trait name was an abbreviation of the molecular phenotype together with the actual genomic position, for example, a hQTL was recorded as H3K27ac (chr1:1234-5678);
- Also, if trans-QTL summary statistics were not provided, we defined a QTL as a trans-QTL if the associated trait was far from the variant location (>10 Mb).
Summary statistic normalization
| Column | Describe |
|---|---|
| p-value | study original P-value (filtered <0.1). |
| effect size | beta, or t-statistic, or chi-squared statistic, or odds ratio, or LOD score. |
| se | standard error, estimate by P-value, sample size, and effect size if missing. |
| fdr | false discovery rate. |
An additional explanation for data source and interpretation
- If the study was not published the DOI of bioRxiv is provided.
- A single QTL study may involve multiple tissue/cell types [e.g., GTEx (Genotype–Tissue Expression project) and DICE], various molecular phenotypes [e.g., BLUEPRINT], several human populations, or different mapping strategies (e.g., genotype-based and allele-specific), we split such QTL results into multiple sets and assigned unique source IDs to distinguish the data.
Database usage
Search by variant
QTLbase accepts variant-level queries by either dbSNP ID (e.g. rs4728142) or genomic position (chr7:128573967), and displays query results on a dynamic web page.
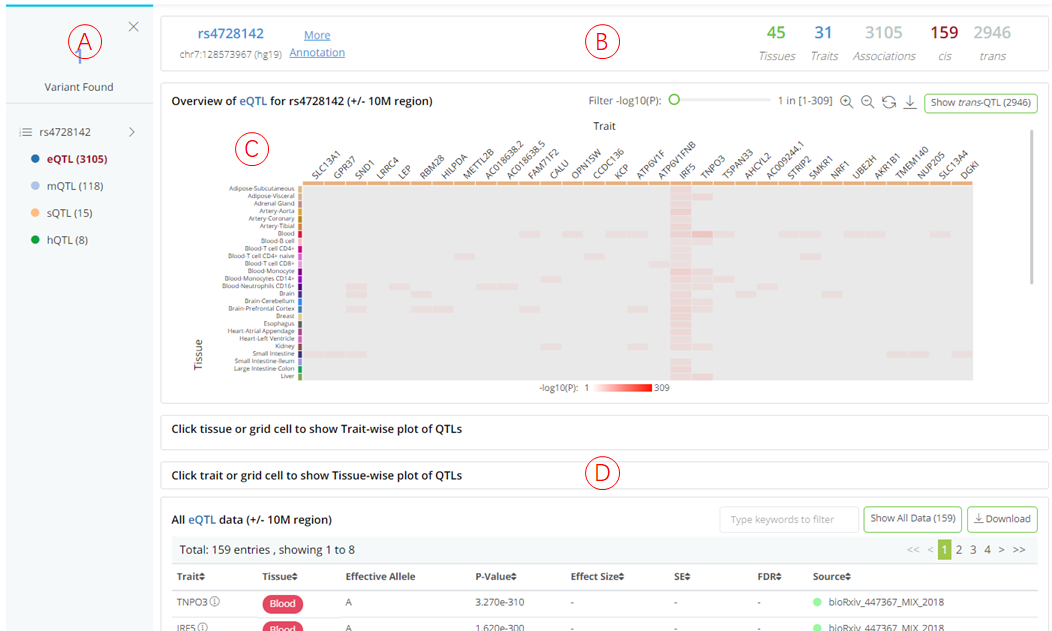
(A): The panel shows matched cis-xQTL types and the number of associated traits for query variant. Users can click on each QTL type to inspect detailed information in the panel on the right.
(B): Summary information about the selected QTL type, including the query variant, allele information, number of associated tissue/cell types, number of associated molecular traits, total QTL associations, and total cis- and trans-QTLs.
(C): Heatmap (tissues .vs. traits) visualizes the distribution of the associated traits across tissue/cell types. Each row depicts a separate tissue/cell type, each column represents a QTL-associated trait. The grid color represents the median P-value of the QTLs on a particular tissue and trait. Clicking on each grid in the heatmap will highlight the associated QTLs with the specific trait and tissue in both phenome- and tissue-wise plots. Hovering tissue row, trait column, or grid cell to check description information of corresponding items.
(D): Summary statistics table for selected QTL type regarding to query variant, which is searchable and downloadable.
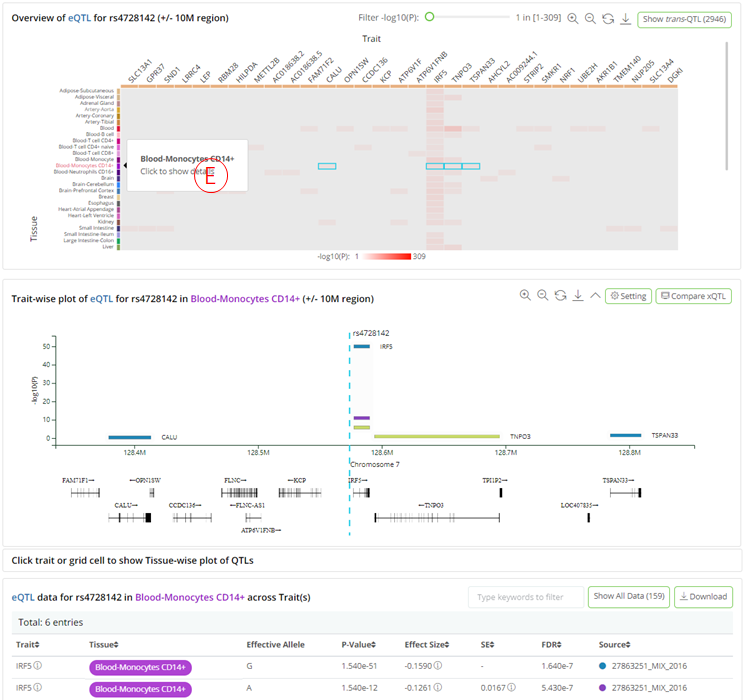
- (E): Clicking on each tissue row in the heatmap opens a phenome-wise plot that displays the genomic distribution of the QTL-associated traits, accompanied by their significance and gene annotations. The plot is highly interactive and can be synchronized with the bottom summary statistics table. The colors of the glyph represent the source where the QTL came from.
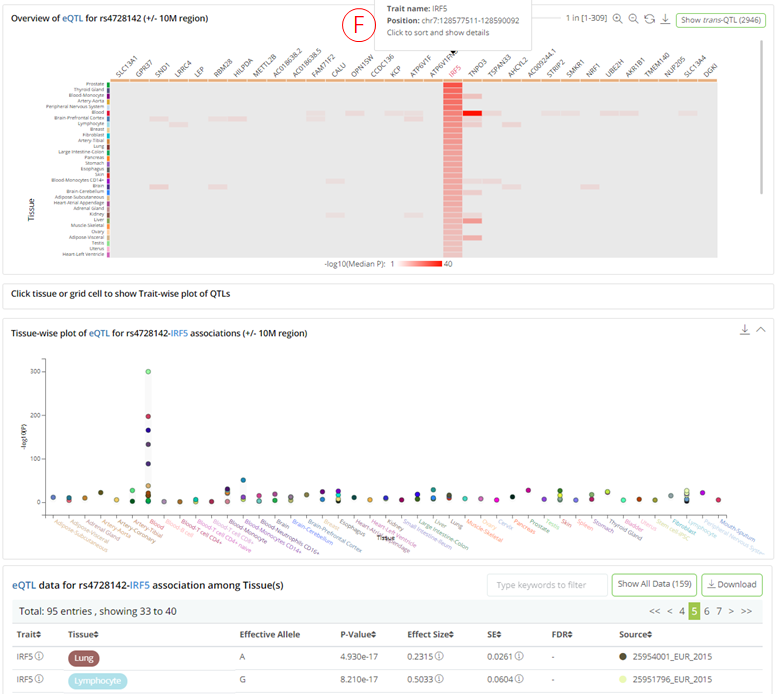
- (F): Clicking on each trait column in the heatmap brings a tissue-wise plot to the front and shows the significance of the QTLs across the related tissue/cell types. The plot is highly interactive and can be synchronized with the bottom summary statistics table. The colors of the glyph represent the source where the QTL came from.
- By clicking 'Show trans-QTL' button, the user can switch to trans-xQTLs viewer on this result page (H);
![]()
Search by trait
QTLbase accepts trait-level queries by either trait name (e.g. SORT1 or cg26741686) or genomic position (chr1:109816590-109818590).
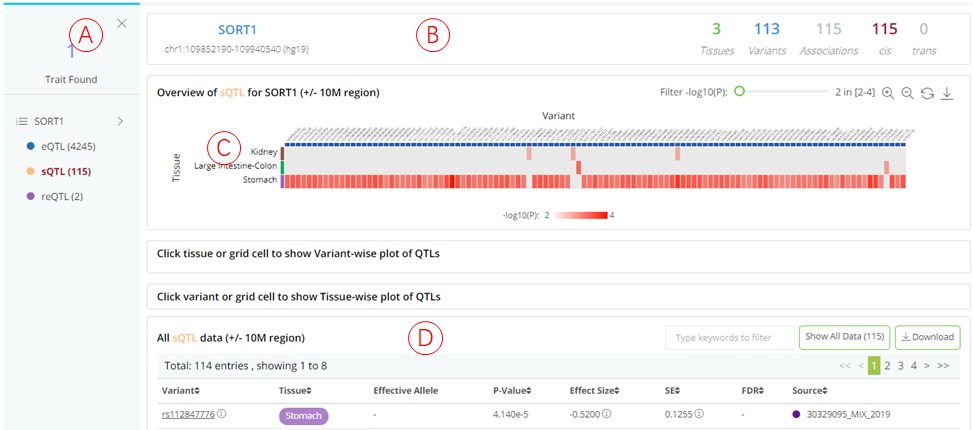
(A): The panel shows the matched QTL types. Users can click on each QTL type to inspect the detailed information in the panel on the right.
(B): Summary information about the query trait and selected QTL type.
(C): The heatmap (tissues .vs. variants) plot shows the distribution of trait-associated variants across tissue/cell types. Each row shows a separate tissue/cell type, each column represents a trait-associated variant. The grid color represents the median P-value of the QTLs for a specific tissue and variant. The results page layout is similar to that of a variant-level query.
(D): Summary statistics table for selected QTL type regarding query trait, which is searchable and downloadable.
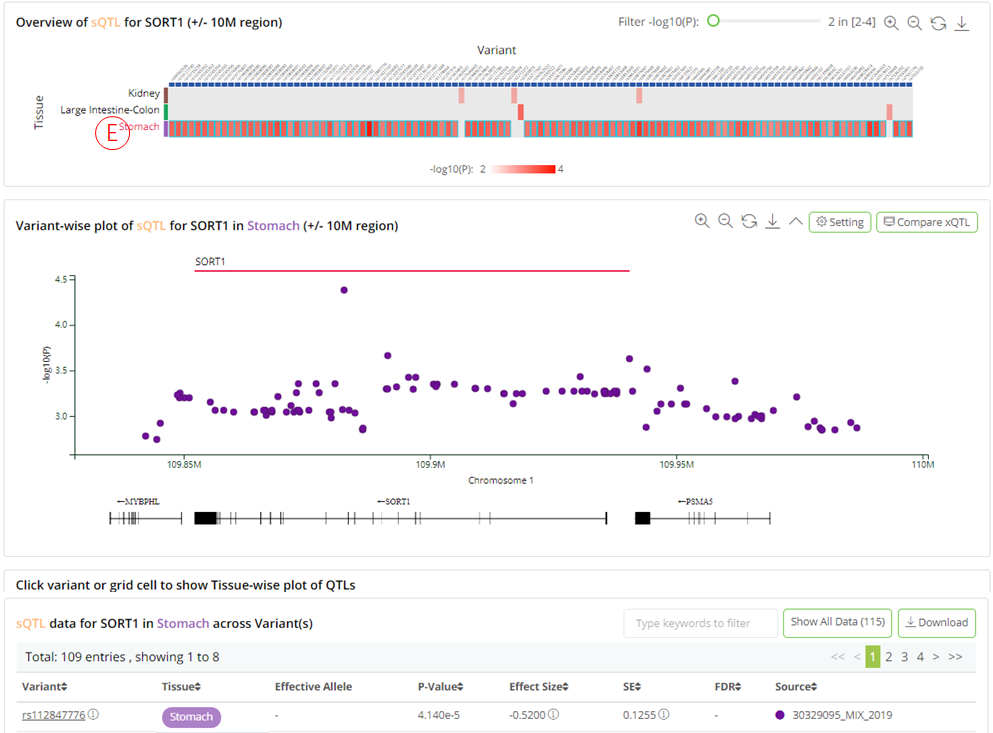
(E): Clicking on each tissue row in the heatmap opens a variant-wise plot displaying the genomic distribution of the trait-related variants, with their significance and gene annotations. The plot is highly interactive and can be synchronized with the bottom summary statistics table.
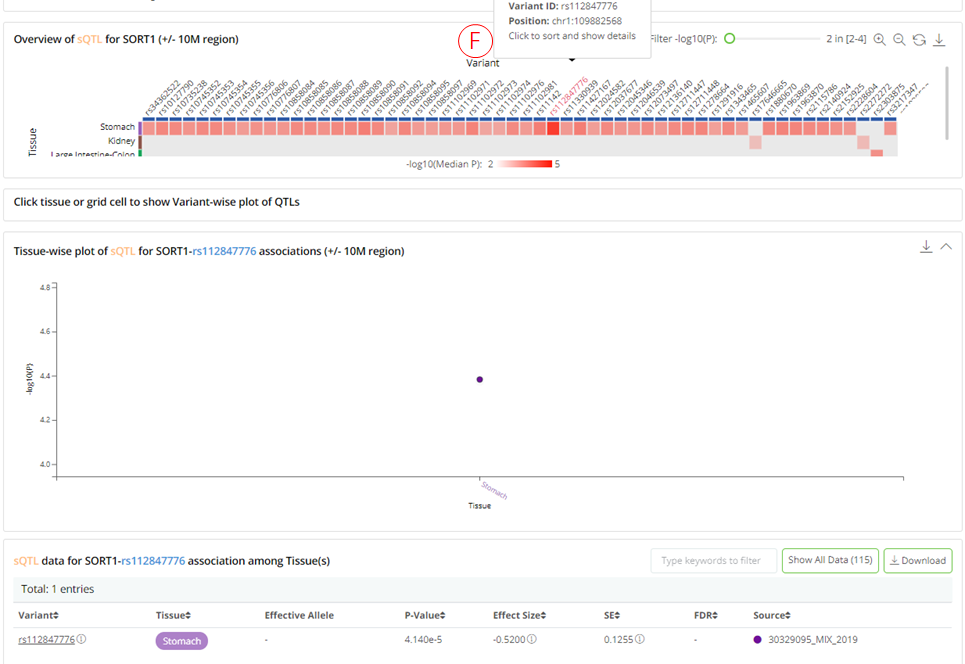
- (F): Clicking on each variant column in the heatmap, opens a tissue-wise plot and shows the significance of the QTLs across the related tissue/cell types. The plot is highly interactive and can be synchronized with the bottom summary statistics table.
Variant Annotation
- (A): The old variant annotation function is deprecated and has been linked to VannoPortal, see http://www.mulinlab.org/vportal/index.html for more details.
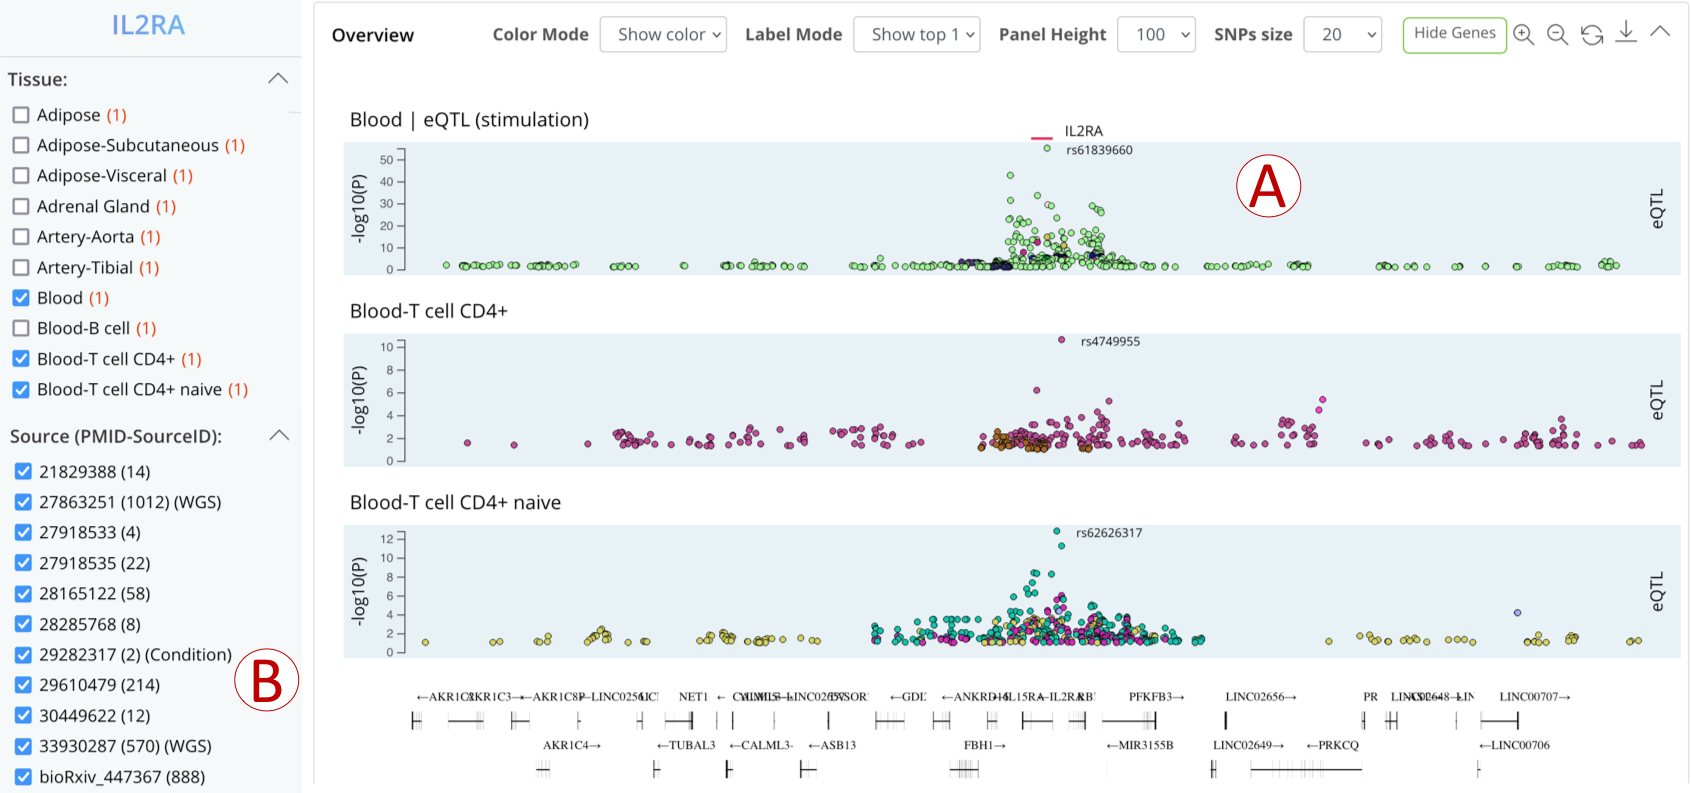
Comparison ViewerNew
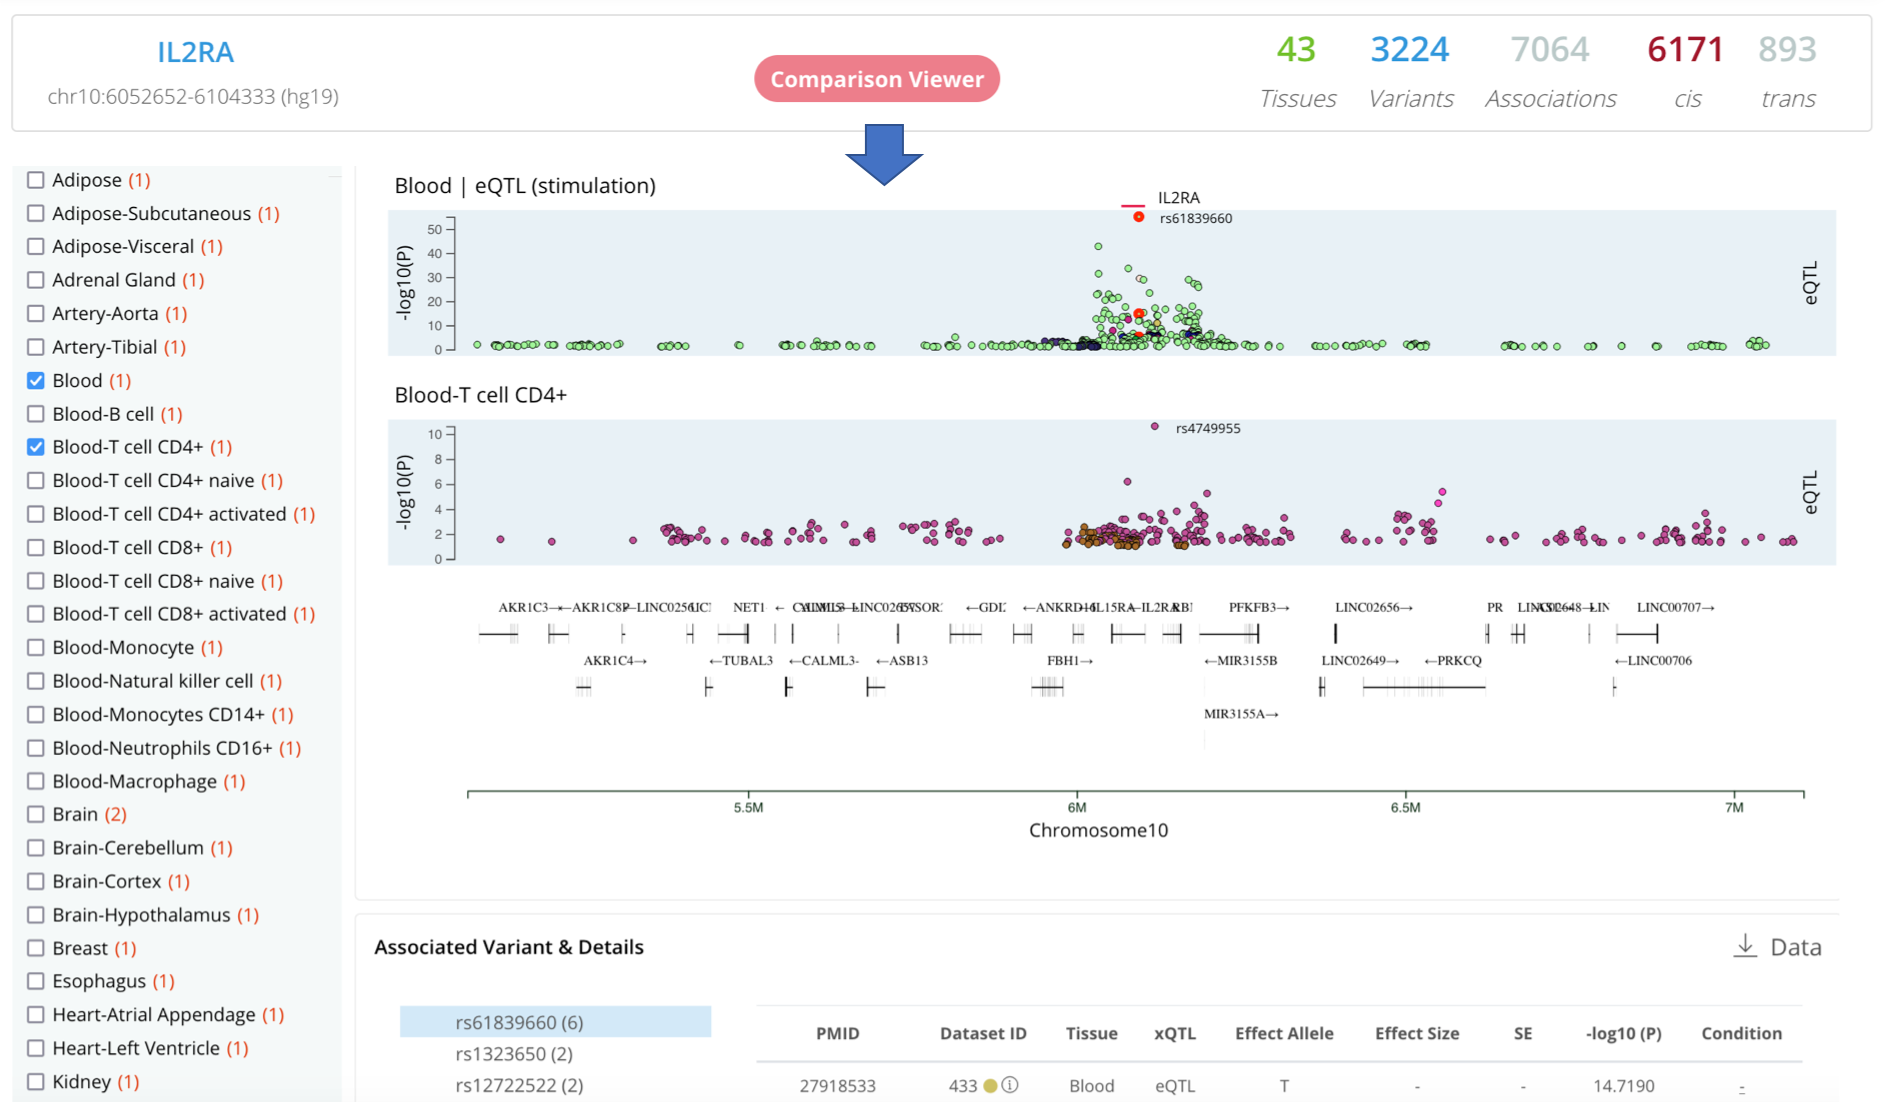
The old comparison viewer function is deprecated, we designed a new page to help the user easily compare context-specific QTLs in a highly interactive web page.
1. Search by variant
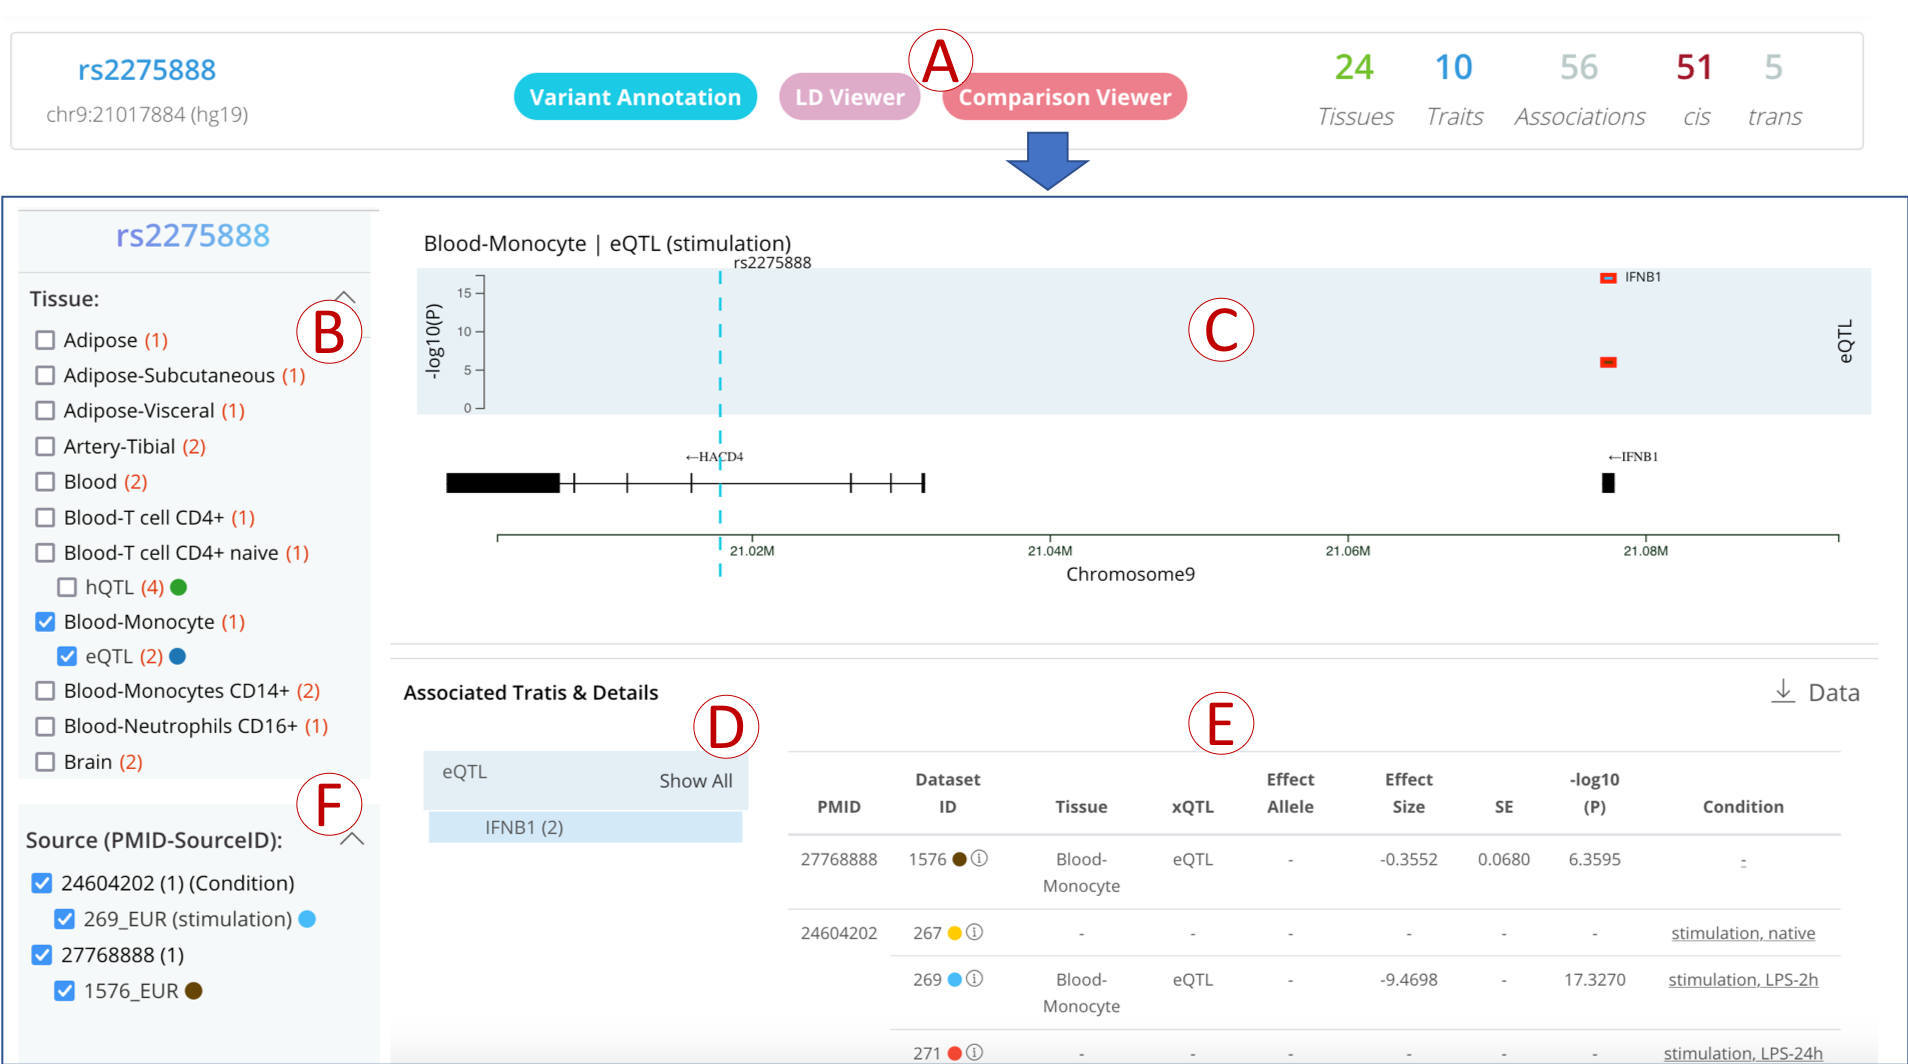
- (A): Simply click on the “Comparison Viewer” button in the variant information panel to open the comparison page;
- (B): All QTLs are classified by tissue, click the tissue label to show the specific QTL types of this tissue, then select a QTL type to show detailed QTL data;
- (C): A trait-wise plot to show the genomic distribution of the QTL-associated traits;
- (D): All traits are summarized in the table, click to show details of the trait;
- (E): All QTL-associated with traits are listed in the table and grouped by the paired dataset of different conditions;
- (F): All datasets are grouped by PMID, unchecked the dataset to filter the QTL on the right panel.
2. Search by trait
Linkage Disequilibrium (LD) ViewerNew
The highly interactive panel allows users to browse the QTL pattern of LD variants linked to the query variant. It can efficiently perform variants expansion in the LD region and get relevant QTL data when adjusting the interested population and LD cutoff. In addition, LD viewer also incorporates several phenotype evidence including disease/trait association information derived from The NHGRI-EBI GWAS Catalog and CAUSALdb
Tissue view
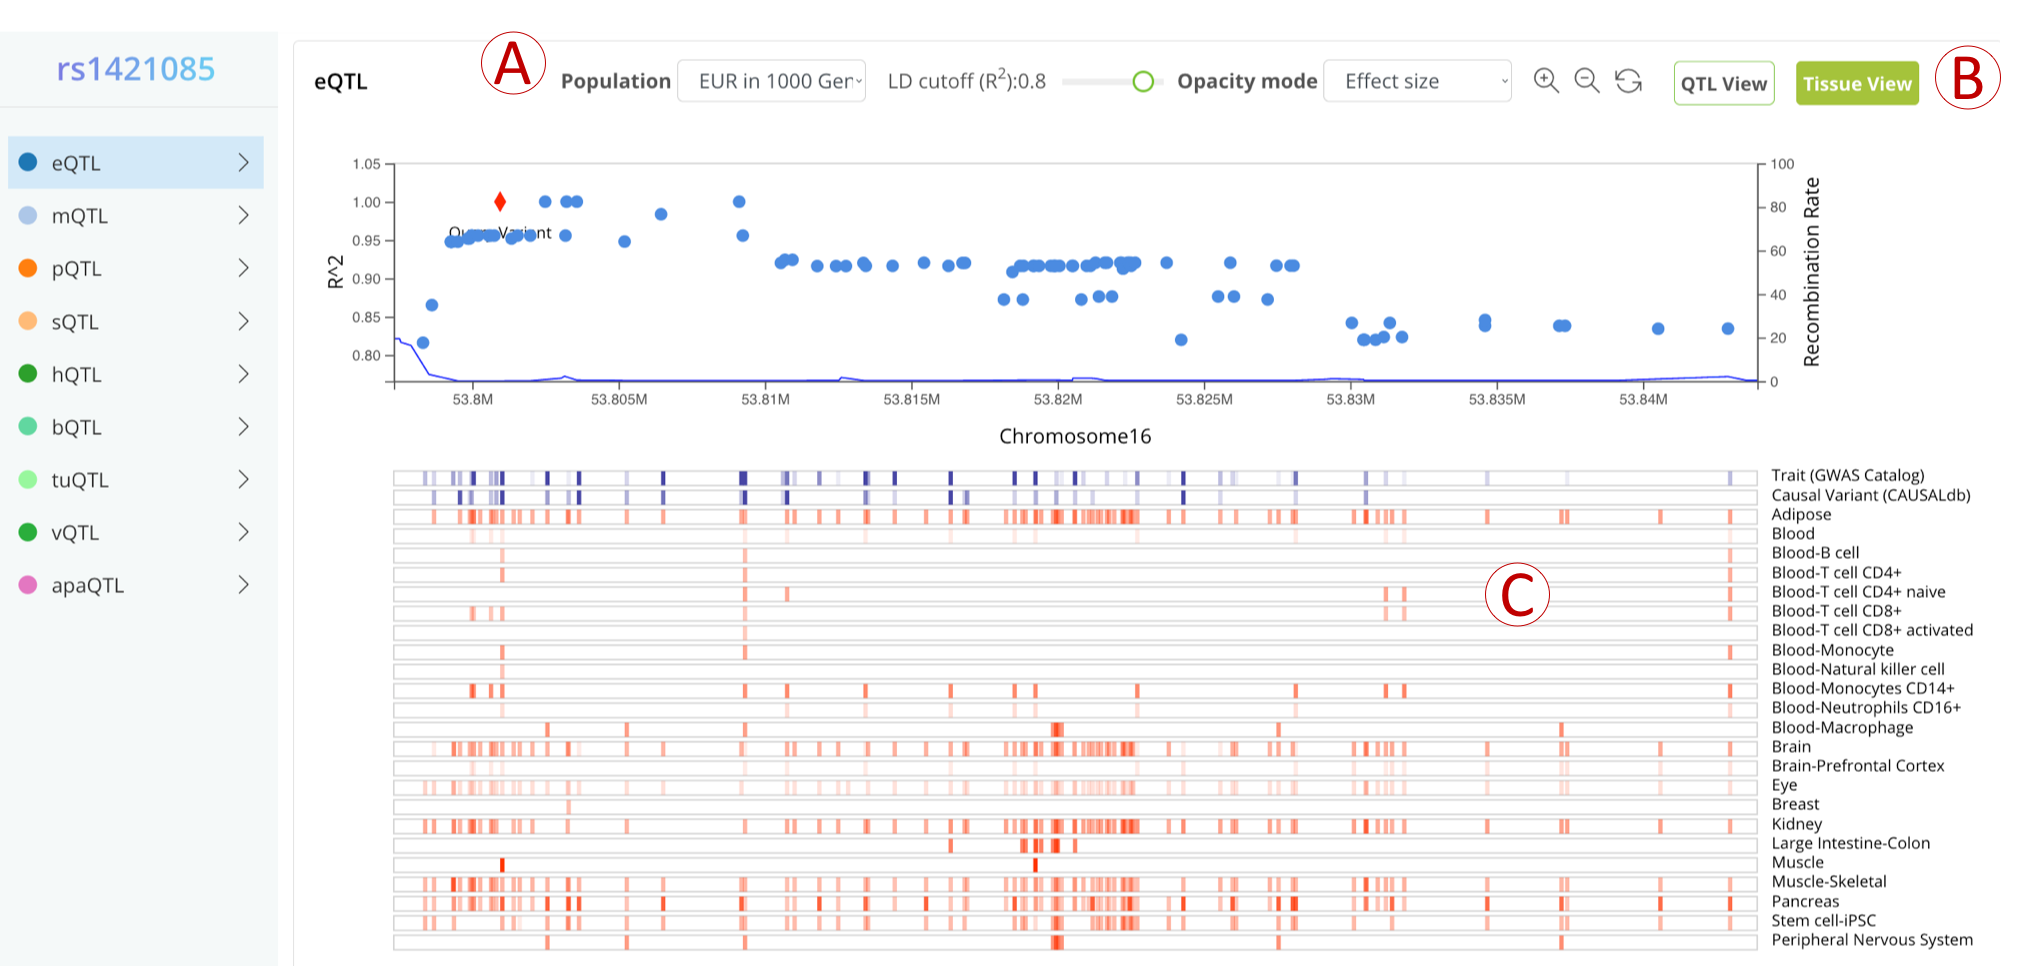
QTL view
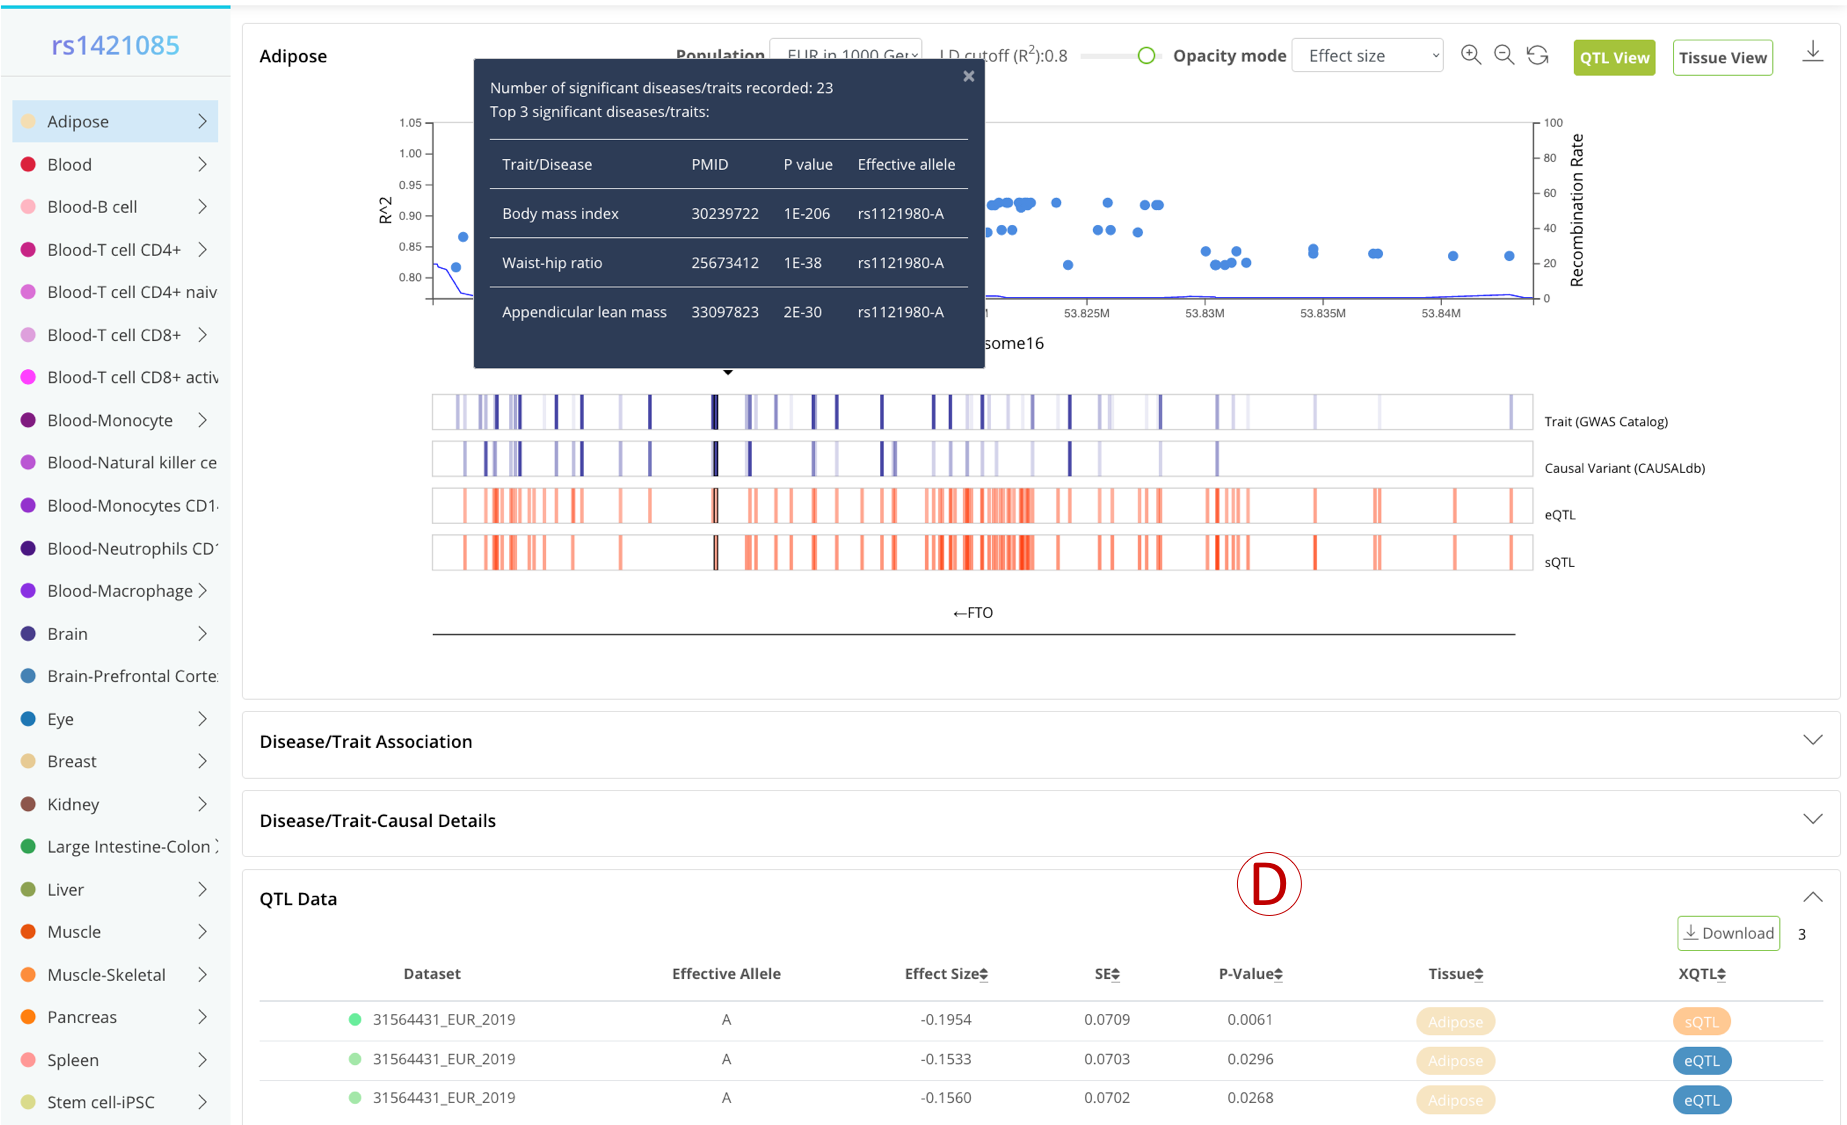
- (A): Settings panel, the user can change the LD region by adjusting the population and LD cutoff. The opacity of the color represents the absolute value of effect size by default, and the user can also change it to represent P-value or QTL number.
- (B): Buttons to switch between different viewers (QTL/Tissue).
- (C): The first two blue bars represents GWAS evidence (opacity of the color represent the number of GWAS and the max posterior probability, respectively), while other red bars represent QTL evidence (opacity of the color represents the absolute value of effect size by default).
- (D): A detailed table to display the relevant GWAS and QTL data of the selected variant.
Associated GenesNew
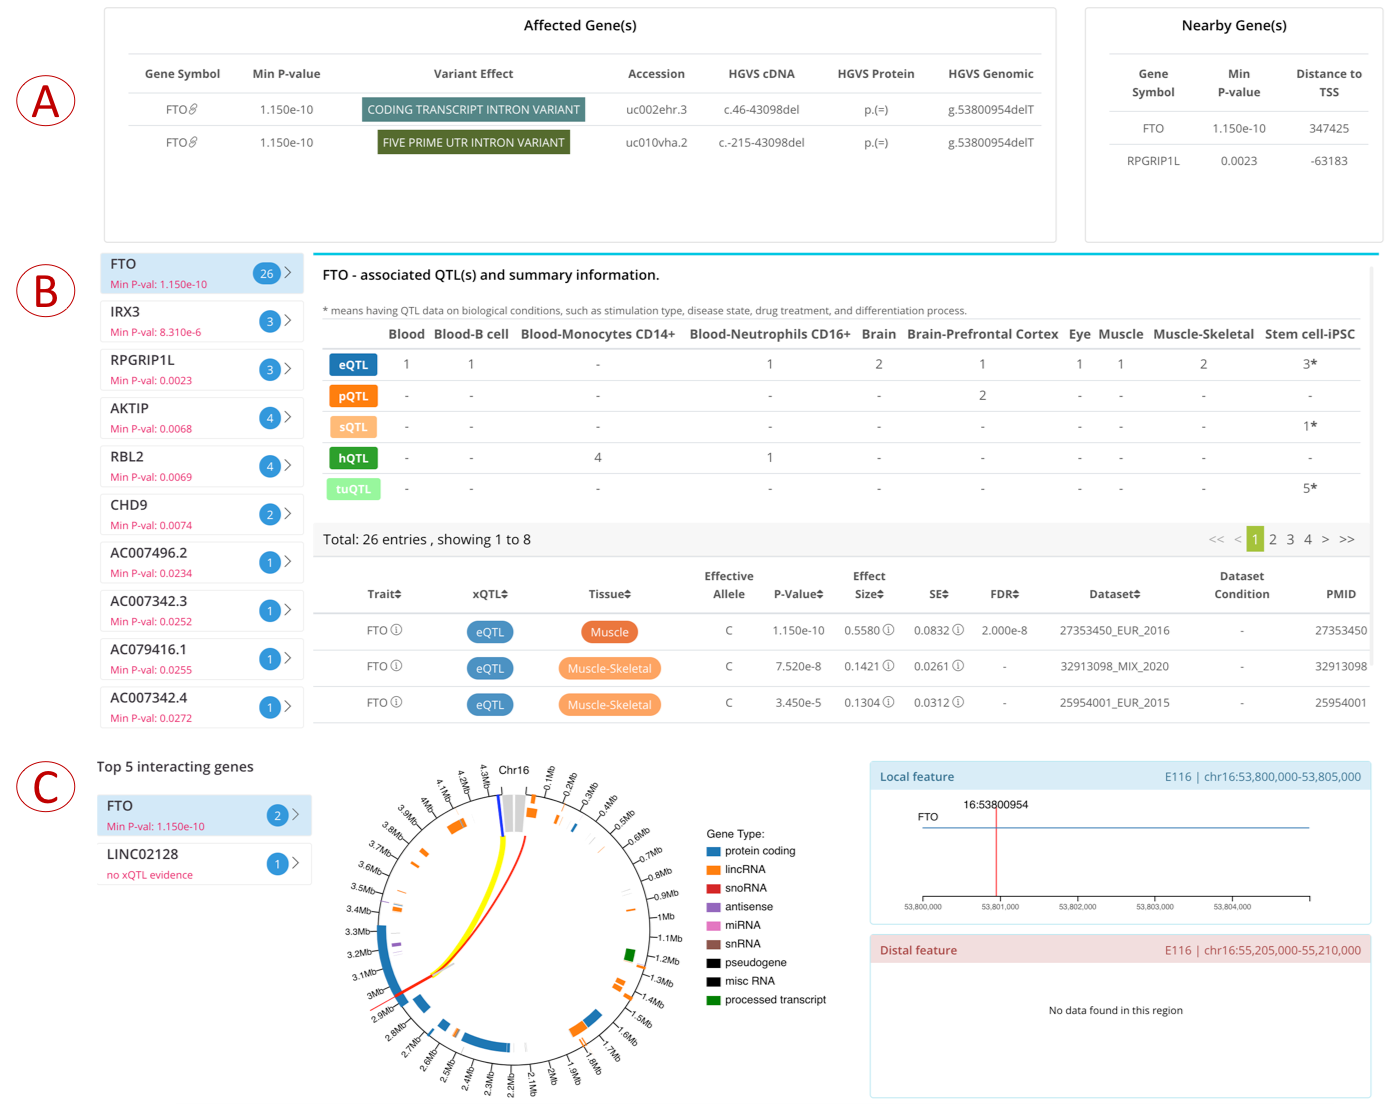
- (A) left: the host genes whose genomic regions overlay the query variant;
- (A) right: the nearest gene that is most close to the query variant;
- (C): the QTL genes which are associated traits with the query variant;
- (D): the interacted genes which are supported by 5kb Hi-C interactions from 60 tissue/cell types collected in our previous web server GWAS4D.
Whole-genome sequencing (WGS) QTLsNew
‘WGS-based xQTLs’ expands the variant query scope to fit 195 QTL datasets based on whole genome sequencing.
- (A): Variant-wise plot to show the genomic distribution of the relevant QTL data in specific tissue based on whole genome sequencing.
- (B): A list summarized all QTL datasets, including WGS, and the datasets can be filtered by clicking the checkbox.
Filter xQTL by biological conditionsNew
‘Filter by biological conditions’ supports QTL filtering on different biological conditions, such as stimulation type, disease state, drug treatment, and differentiation process from 30 independent QTL studies.
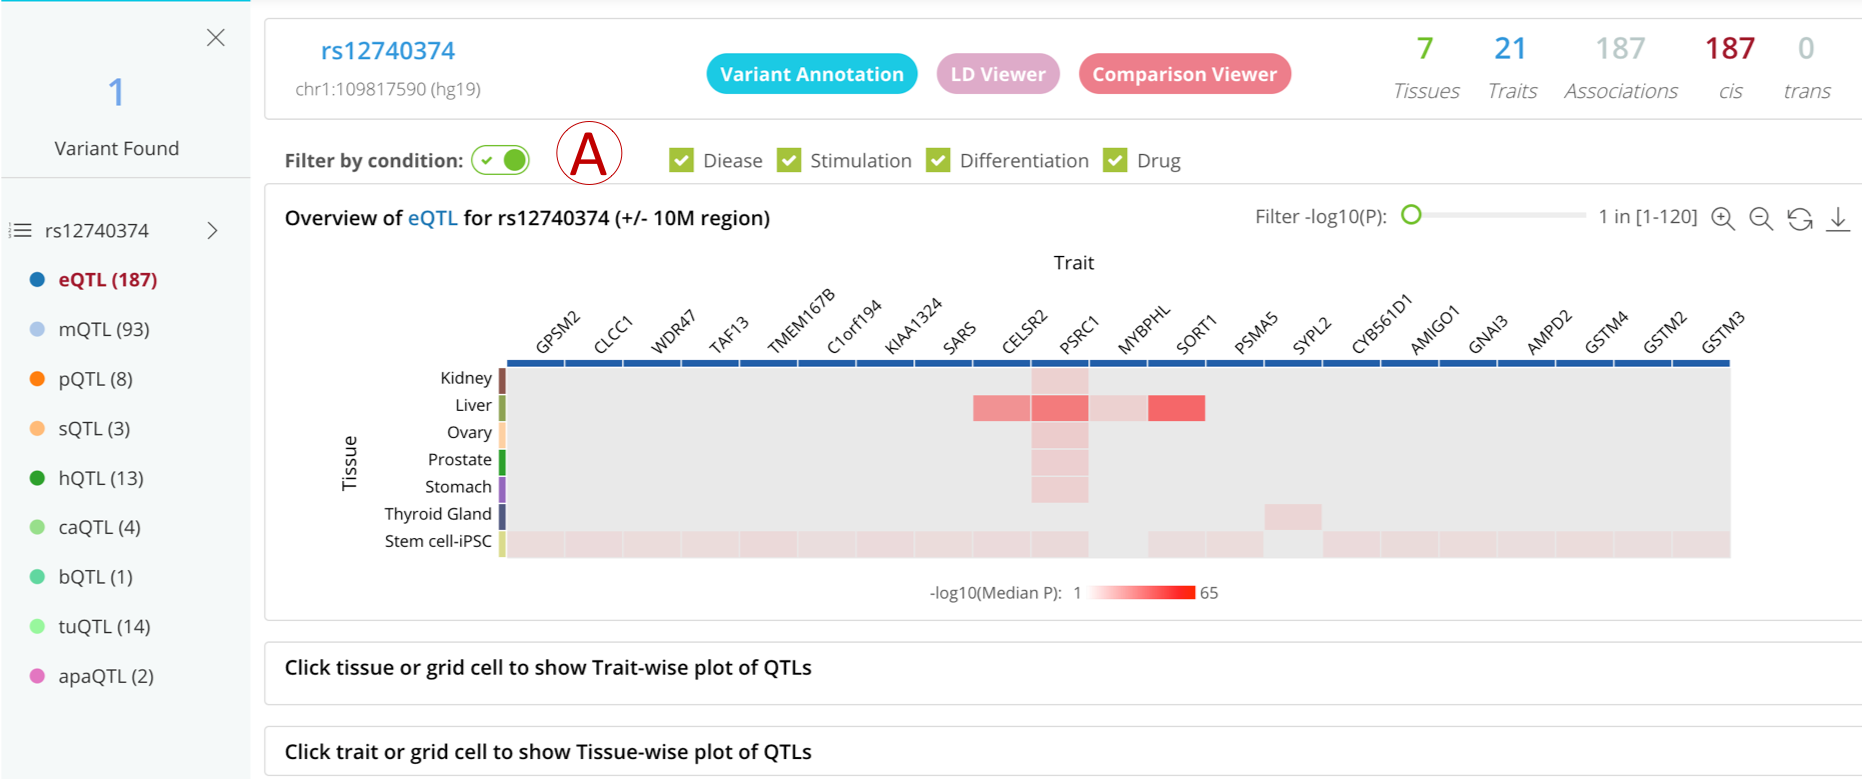
- (A): Check the "Filter by condition" button to filter the QTL data by conditions, including stimulation type, disease state, drug treatment, and differentiation.
Download
All significant xQTLs (P-value < 0.05) and WGS xQTLs (P-value < 0.01) can be downloaded from our web repository.