Causal Usage Documentation Introduction Glossary Database Usage GWAS summary statistics collection and processing Links GWAS resources
Documentation
Introduction
CAUSALdb integrates many GWAS summary statistics and identifies credible sets of causal variants by uniformly processed fine-mapping. The database incorporates over 13,000 public full GWAS summary-level data, which will constantly accumulate according to our timely curation. It estimates causal probabilities of all genetic variants in the GWAS significant loci using state-of-the-art fine-mapping tools. These comprehensive causalities and statistics can be explored in an interactive causal block viewer. Users can also compare causal relations on variant, gene, and trait levels across studies of distinct sample sizes or populations. By integrating massive base-wise and allele-specific functional annotations, causal variants could be further interpreted. The objective of this database is to ensure its convenience and precision for researchers to select and prioritize causal variants for further study.
Glossary
LD blocks
To perform fine-mapping on curated GWAS summary statistics, we partition the genetic variants with relatively independent linkage disequilibrium (LD) blocks estimated by ldetect.
Causal blocks
The LD blocks containing significant variants are called causal blocks for the studies with substantial variants (GWAS P value ≤ 5e-8). We select the LD block for the studies without any significant variants, in which the variant with the lowest P value lies as the causal block.
Lead variants
For studies without genome-wide significant variants (P-value ≤ 5e−8), we only selected the LD block in which the variant with the lowest genome-wide P-value was the potentially causal block for each trait.
Independent signals (New)
Due to the complexity of LD, a local region may contain multiple independent signals. We perform association and stepwise conditional analyses to identify independent signals within regions. We termed the additional signals identified by the conditional analysis secondary signals.
Functionally informed fine-mapping (New)
Functionally informed fine-mapping is a genetic mapping technique that combines functional data and statistical methods to identify causal genetic variants underlying complex traits and diseases. It aims to pinpoint the functional genetic variants responsible for disease associations by incorporating functional annotations of genetic variants, such as regulatory elements, chromatin accessibility, and gene expression data. This approach helps narrow down the potential causal variants for follow-up experimental validation and can provide insights into disease mechanisms. The functional annotations are usually based on prior knowledge and experimental data, such as data from genome-wide association studies (GWAS) or epigenetic studies. In CAUSALdb v2.0, the Functionally informed fine-mapping is powered by PolyFUN.
Posterior probability (PP) of causality
The posterior probabilities for different models can be used to determine the minimum set of variants required to capture the likely causal variants (credible sets).
Credible sets
The set of variants with a sum of PP more than α (default: 0.95) means taking the cumulative sum of PPs from largest to smallest until it is not smaller than α.
Causal variants
The variants in the credible sets.
Database Usage
Integrated causal block viewer
To ensure interactive visualization and seamless operation of genome-wide summary statistics in the web environment, we designed an optimized web architecture to reduce intensive network data transmission load and developed dynamic Manhattan and LocusZoom-like plots. We first introduced a causal block viewer that integrates QQ, Manhattan, and LocusZoom-like plots, a table displaying credible set variants, and a variant annotation panel into a user-friendly web page.

1. Meta information panel
Some basic information about the related GWAS is reported trait, author, PubMed ID, sample size, population, and MeSH term. The details of data normalization are described in the Publicly available GWAS section.
2. QQ Plot
Quantile-quantile plot of excepted -log10(P) VS observed -log10(P)
3. Manhattan Plot
An interactive scatter plot displays -log10(P) of genome-wide variants. Each highlighted strip represents a causal block and is clickable to show the details of the causal block on the plot below. Users can also use the “Prev Block” and “Next Block” buttons to switch interested blocks.
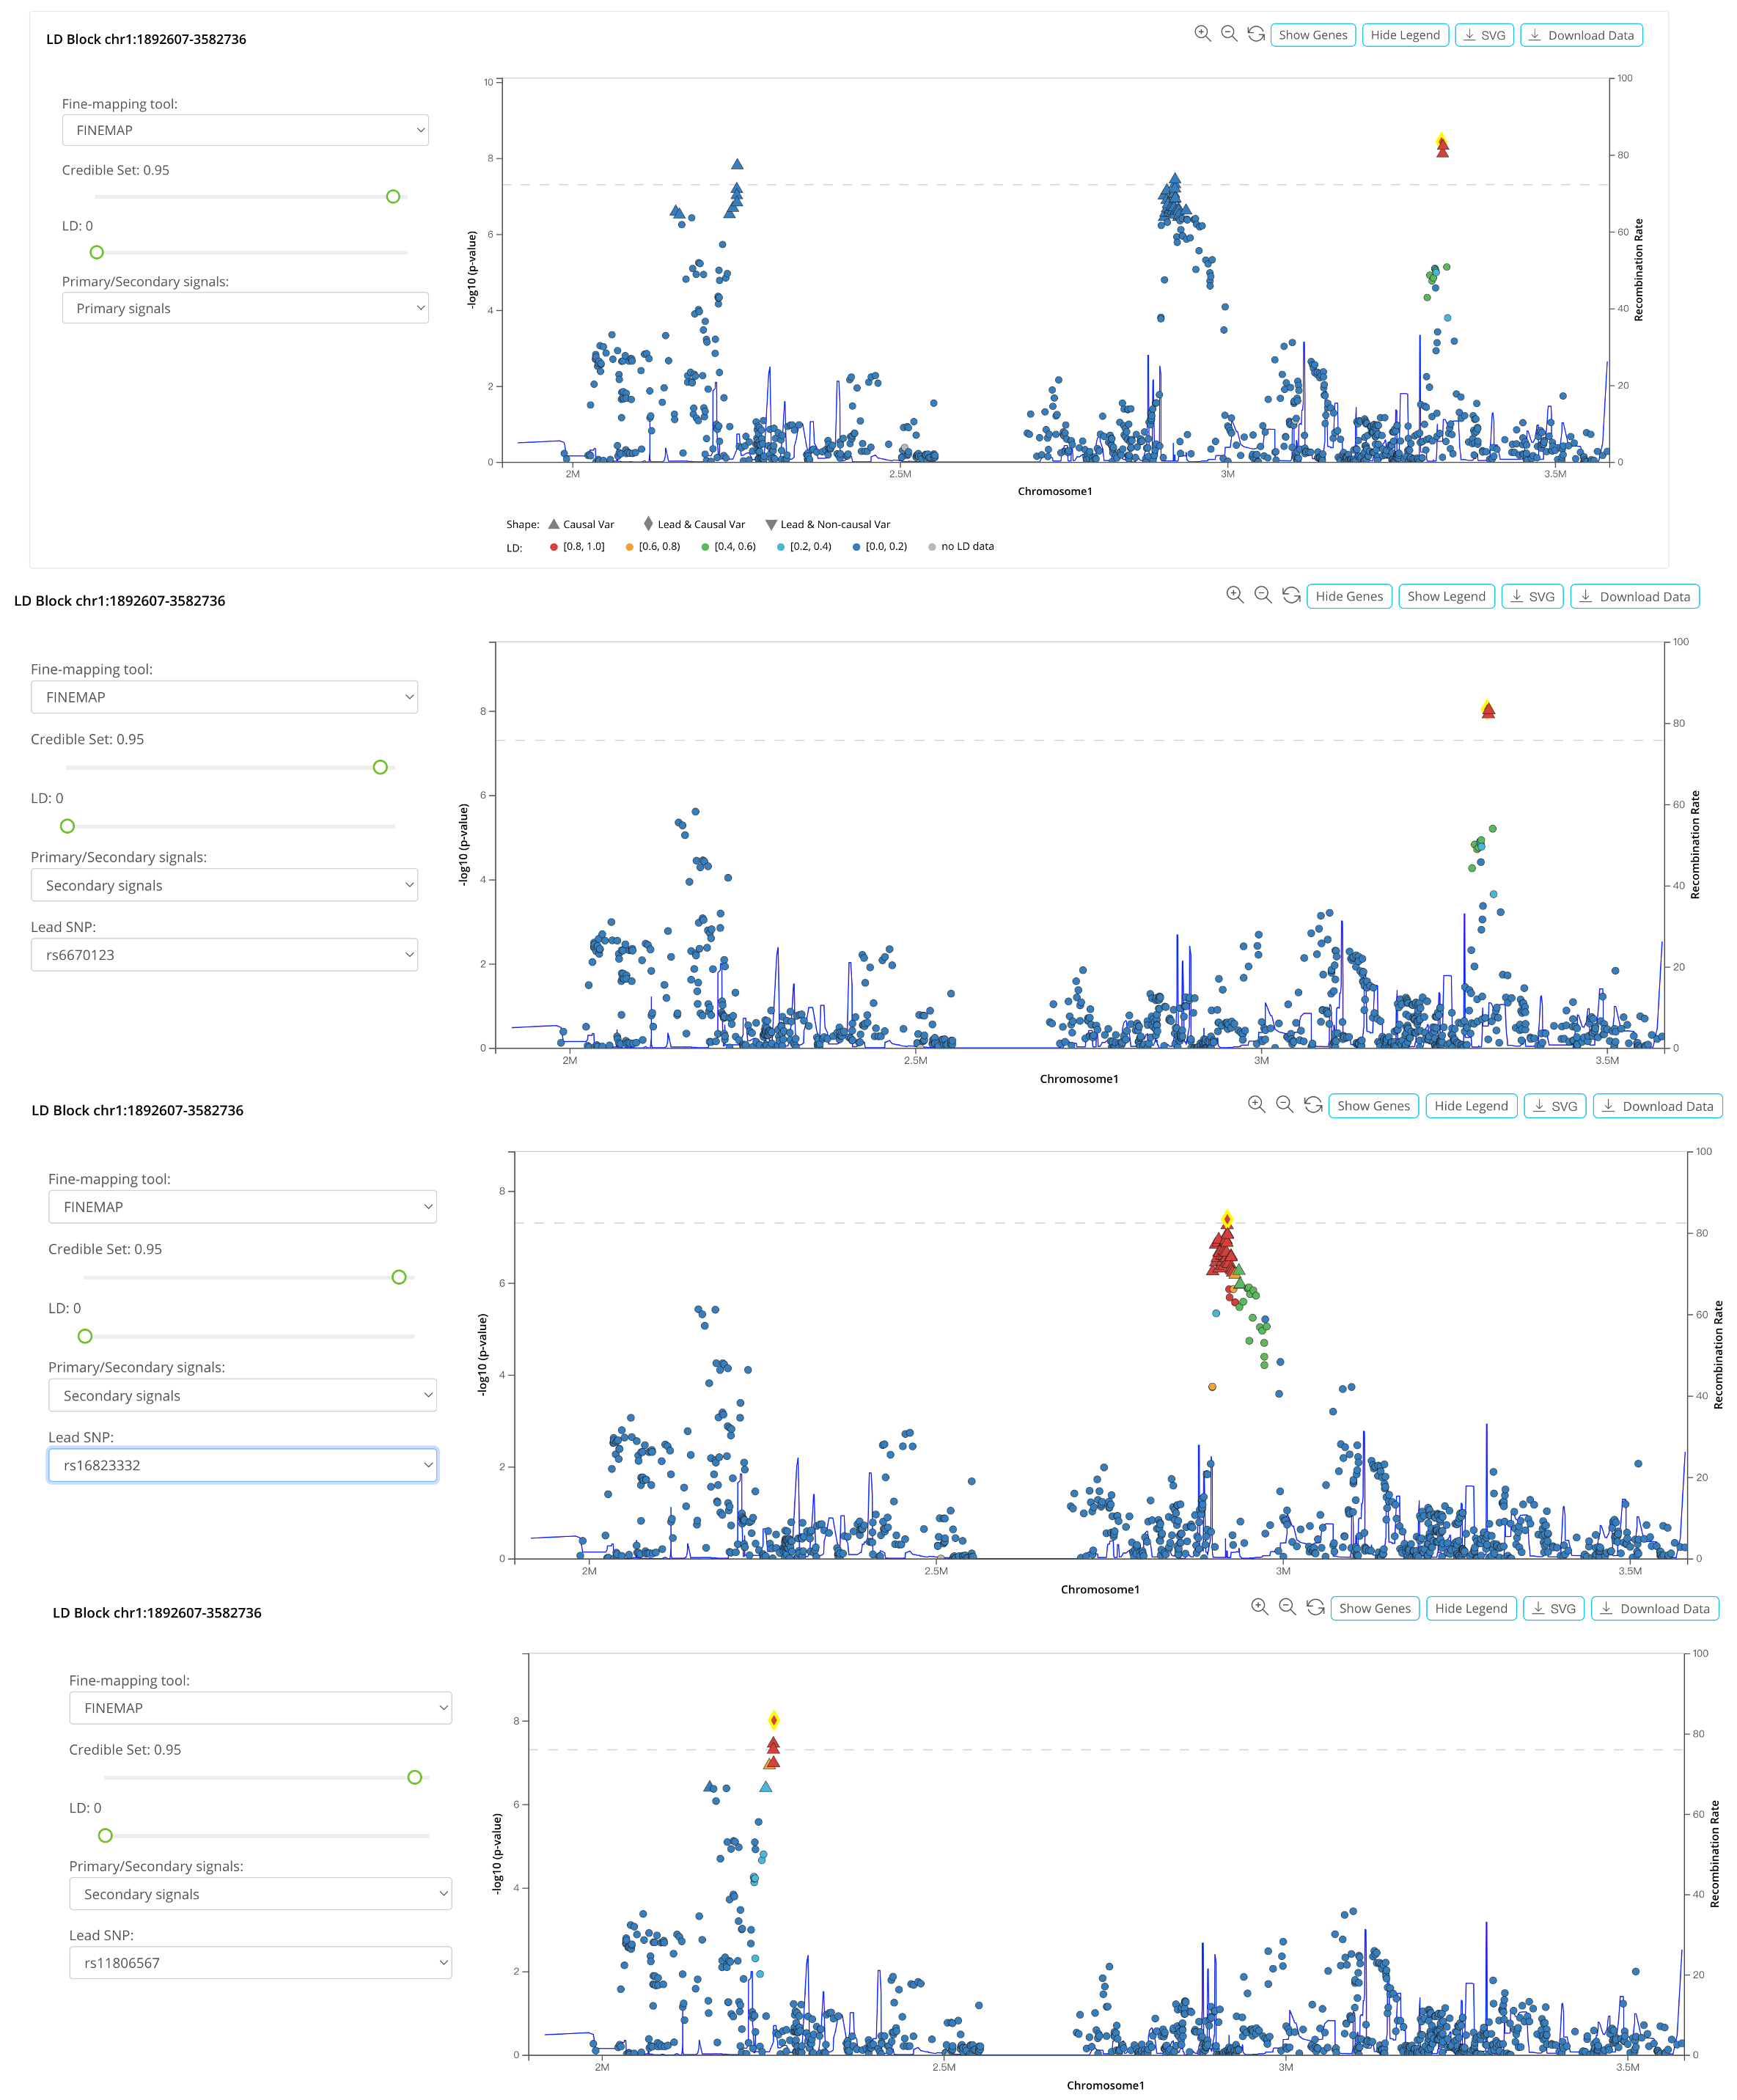
4. LD Block Plot (Updated)
LocusZoom[2] plot of the causal block.
a. We implemented a similar look as the LocusZoom plot for each causal block.
b. We added some glyphs to signify the credible set and leading variant. Triangles represent the variants in the credible set, and the diamond represents the potential causal variant with a leading GWAS signal. When the leading variant is not in the credible set, it will be marked with an inverted triangle.
c. Users can switch the results of different fine-mapping tools. When multiple independent signals exist, users switch signals by choosing additional lead SNPs.
d. Users can zoom in and zoom out with the buttons smoothly.
e. Users can click each variant in the plot to check the summary statistics and causality information and reset any variant as an LD proxy.
f. Gene annotation tracks can be activated by clicking the “Show Genes” button.
g. Users can download complete summary statistics for the causal block for further analysis by clicking the “Download Data” button.
h. By dragging the slider bar, users can adjust the fine-mapping tools, credible set threshold, and LD r2 to filter out variants in the LocusZoom-like plot.
5. Table of causal variants
Details of the causal variants. Users can sort by position, PP, or other items. Users can select variants to compare the functional annotation of interested variants, which is a feasible way to prioritize.

Search Function
The searchable variants and associated traits in our CAUSALdb include 1) all causal variants in the 99% credible sets defined by the tree fine-mapping tools; 2) significant (GWAS p-value ≤ 5e-8) variants but non-causal variants in all collected GWAS summary statistics. Like GWAS Catalog and GWASdb, we allow users to explore the causality of their interested variants, traits, genes, and chromosome locus.
-
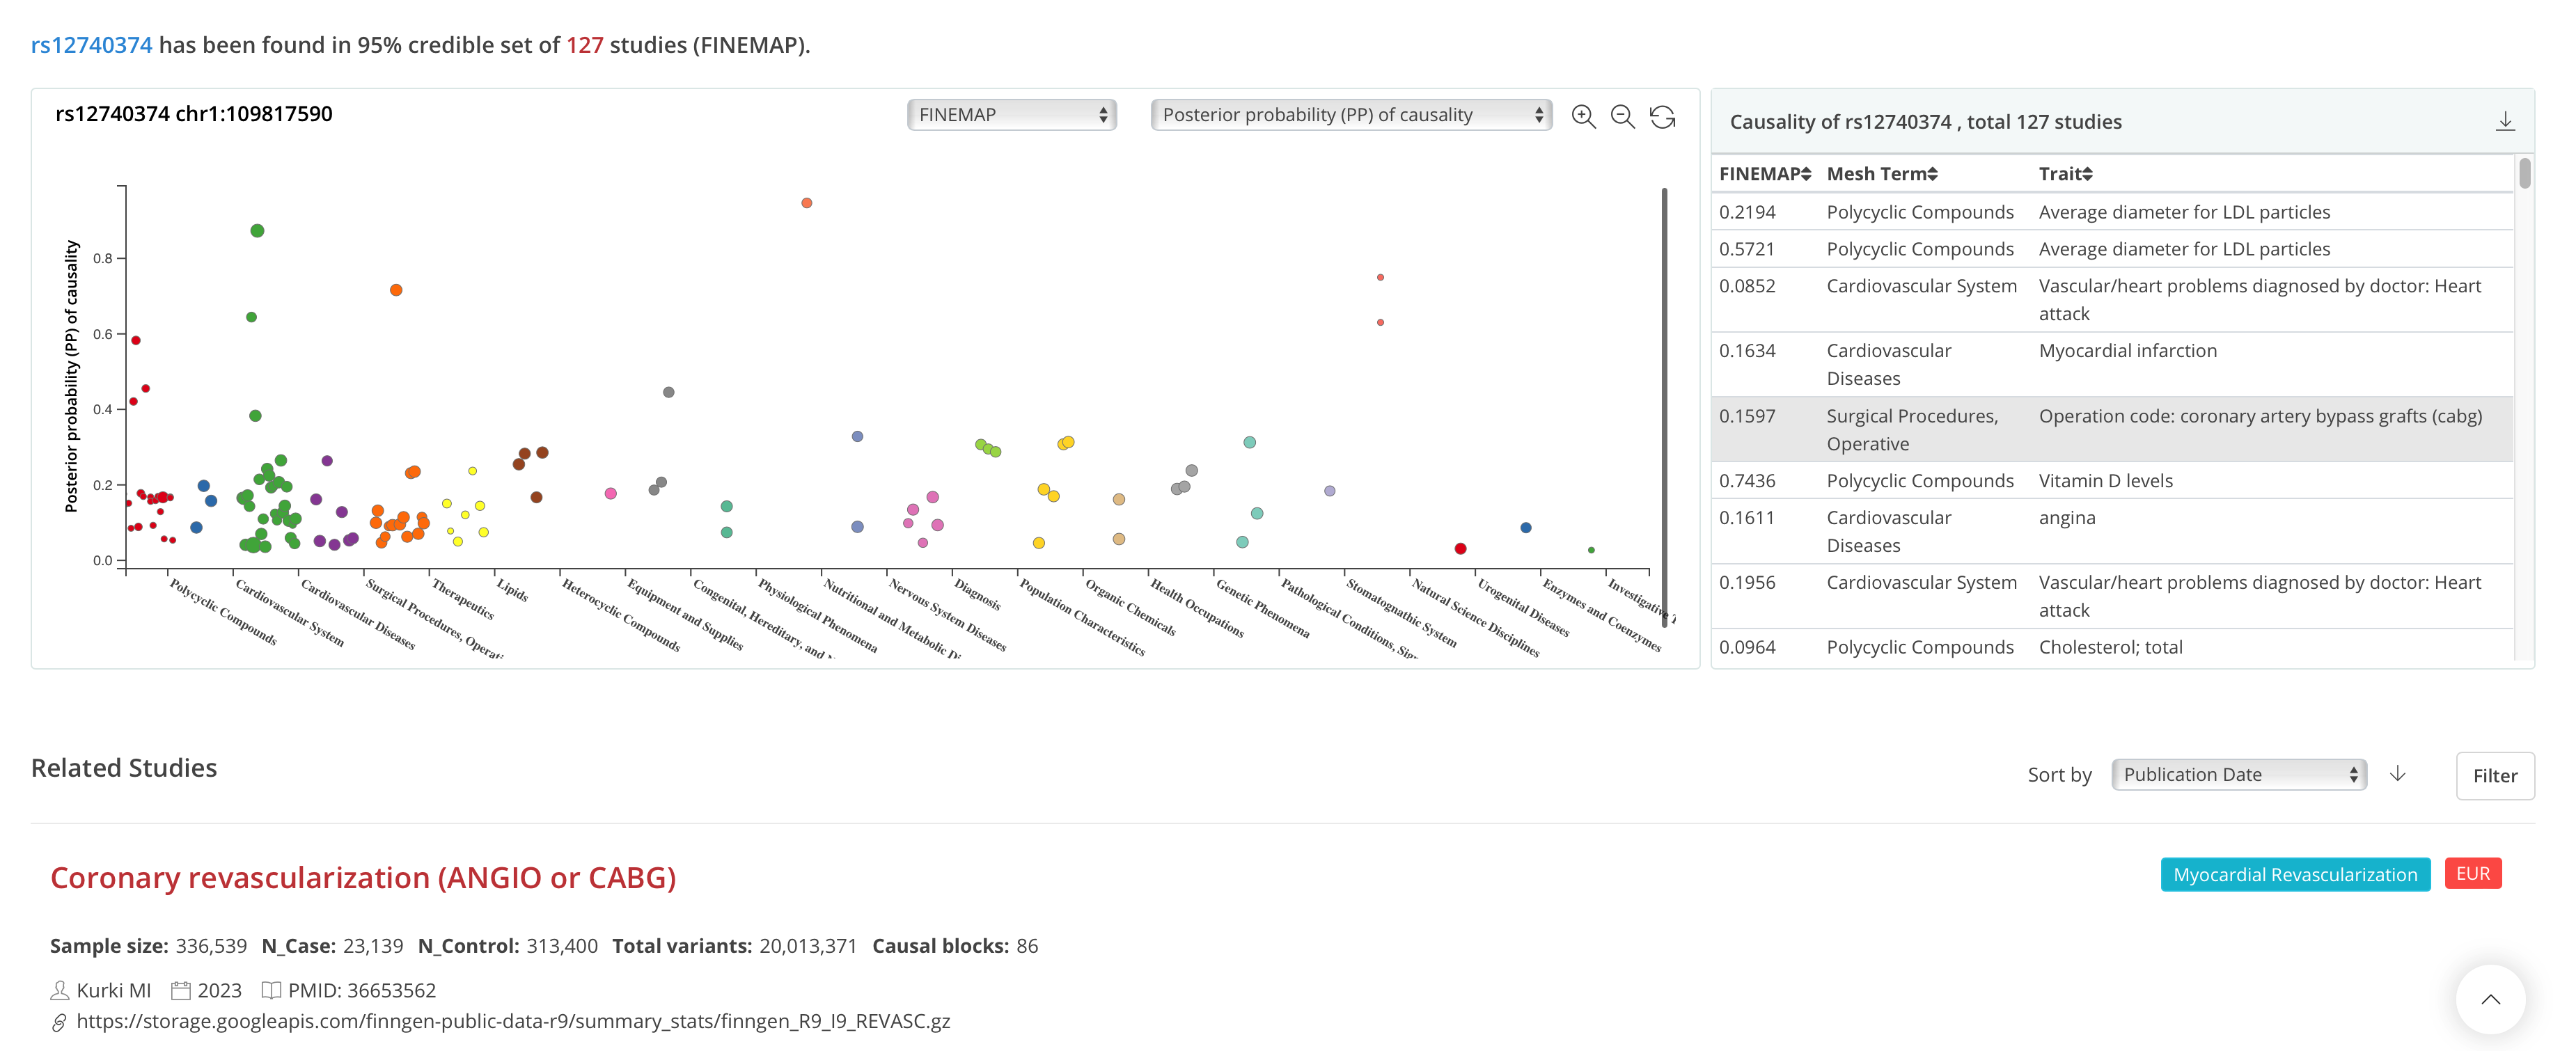
Search by variant (Updated)
By searching for either rsID or variant chromosome position, users can visualize the PP of the causality or the original GWAS P in a scatter plot. Users can inspect the summary table on the right of the scatter plot and switch the fine-mapping tools via a drop-down box. The link on the hover tip can directly guide users to the causal block viewer of a particular study.
Note: As fine-mapping would have narrowed down the significant variants to a smaller set, users sometimes may get no results when searching for rsID. We have included an additional query function for users to browse variants with genome-wide significance by clicking “Only show P-value” in a phenome-wide-like plot.
-
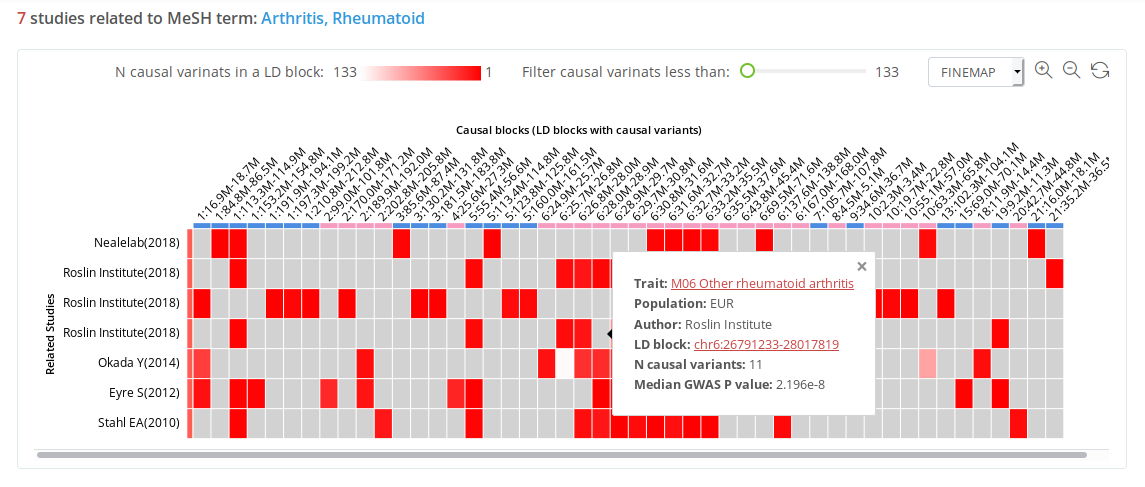
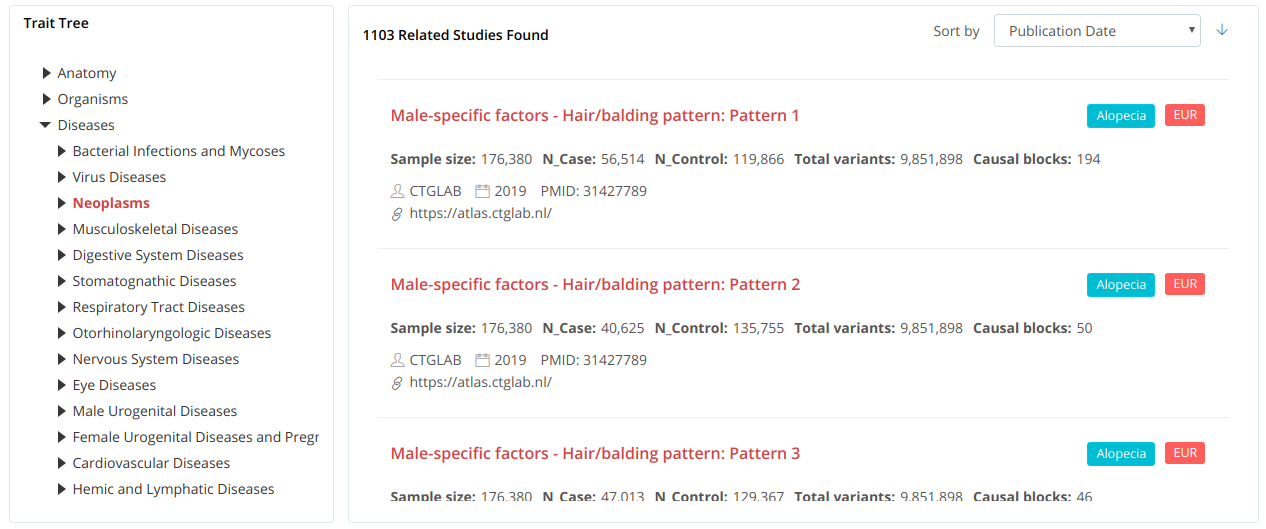
Search by trait
Auto-completion should help users select the potential trait from the mapped MeSH terms when searching for a trait name. In the search result, users can see all causal blocks across the studies related to the searched trait in a heatmap plot. Each column represents an independent causal block, and each row depicts a separate GWAS. The grid color in the heatmap represents the number of potential causal variants in a corresponding causal block. On the hover tips, users can find the median GWAS P of the credible set, and on clicking the block genomic position, they can navigate to the corresponding block view page.
-
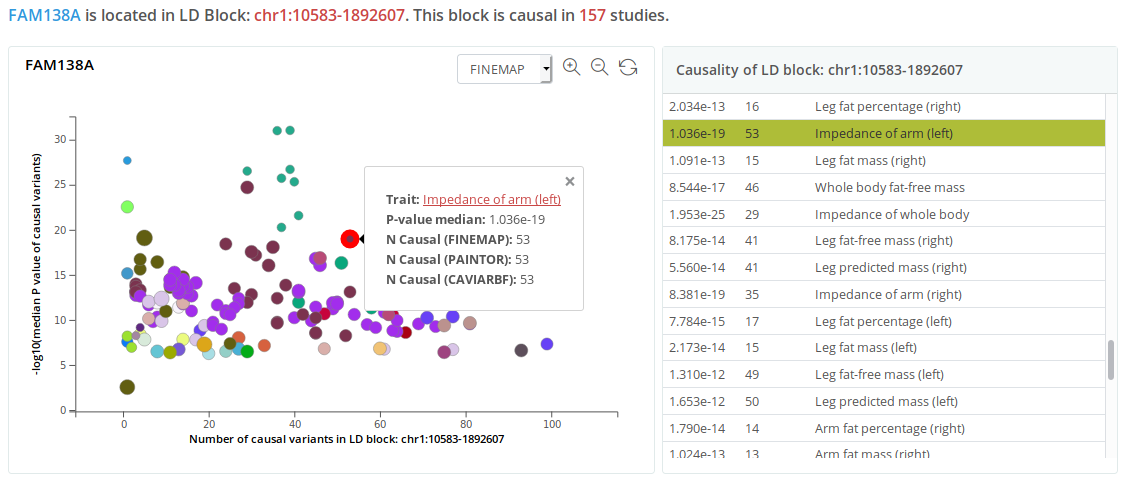
Search by gene
By searching for a gene name, considering that the average length of LD blocks is 1.6 Mb, the system will locate the target LD block in which the searched gene is present and display a block-wise causality plot (the number of potential causal variants in the LD block versus the median GWAS P of these variants).
-
Search by chromosome region
By searching for a chromosome region that is <10 Mb, users can investigate the causality of the most relevant LD block overlapped with the input region, and the results are similar to those when searching for a gene. By mapping the reported traits to MeSH,
-
Search by chromosome region
We established an ontology tree for users to browse the profile information of our collected GWASs, which further facilitates the navigation to traits of interest and the related causal block viewer.
GWAS summary statistics collection and processing
Data source
We collected publicly available GWAS summary statistics from large GWAS repositories: LD Hub, GRASP, PhenoScanner, GWAS Catalog, Pan-UKBB, FinnGen, and dbGaP. We also curated GWAS summary statistics by manually searching.
Meta information on GWAS studies
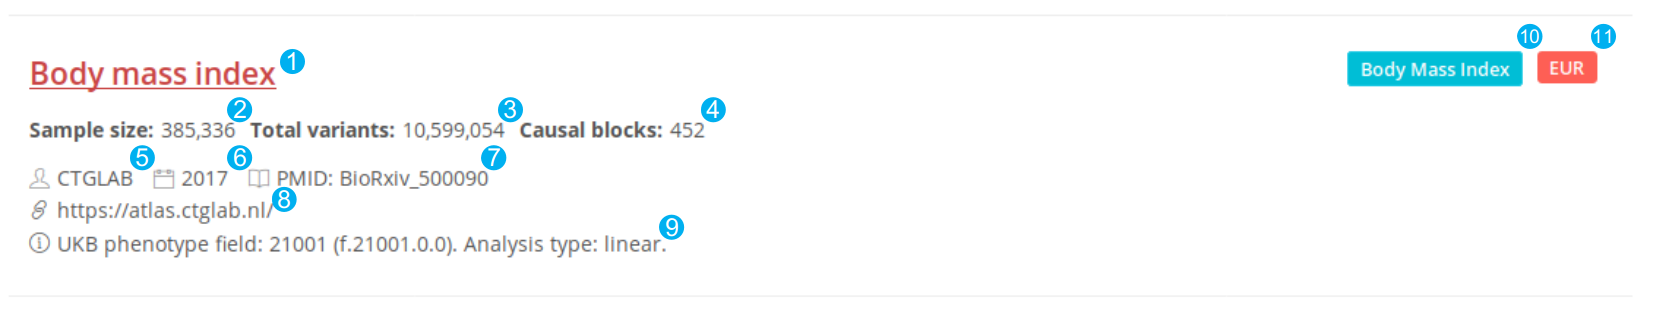
We display the meta information of every GWAS on a unified panel. Every link of the reported trait in the panel can lead users to the corresponding causal block view page. This information is recorded initially or normalized as follows:
- Reported trait
- Sample size found in the original study. For binary traits, the numbers of cases of control are available.
- The number of total variants in the summary statistics passed the Pre-fine-mapping QC.
- The number of LD blocks containing causal variants
- The first author or the consortium
- The year of publication
- The PubMed ID of the study or the ID in the BioRxiv
- The link to the summary statistics
- Notes of Pre-fine-mapping QC, such as no MAF or SE
- MeSH term the reported trait mapped to
- We mapped the ancestries of the studies to six populations: EUR, EAS, SAS, AMR, AFR, and UKB.
Ontology mapping
We have mapped the reported traits of curated GWAS to MeSH 2022 manually.
LD Reference panel (Updated)
In v1., we used the 1000G Phase3 as the LD reference. In v2., we used the newer and larger LD reference panel for the six populations.
| Population | LD reference (v1) | Sample size (v1) | LD reference (v2) | Sample size (v2) |
|---|---|---|---|---|
| EUR | 1000G Phase3 EUR | 503 | TOPMED EUR | 25991 |
| UKB | 1000G Phase3 EUR | 503 | UKB random 10k | 10000 |
| EAS | 1000G Phase3 EAS | 504 | SG10K | 4810 |
| AFR | 1000G Phase3 AFR | 661 | TOPMED AFR | 5965 |
| SAS | 1000G Phase3 SAS | 489 | 1000G Phase4 SAS | 489 |
| AMR | 1000G Phase3 AMR | 347 | 1000G Phase4 AMR | 347 |
Pre-fine-mapping QC
We performed a series of QC steps on the raw downloaded data to ensure that these curated GWAS summary statistics fit the input requirements of fine-mapping tools.
Columns of the summary statistics:
| Column | Description |
|---|---|
| CHR | chromosome, extract from dbSNP 156 if missing in the raw data, only autosome |
| BP | hg19 genome coordinate, extract from dbSNP 151 according to the rsID if missing in the raw data |
| rsID | Version: dbSNP 156, extract from dbSNP 151 according to the position and alleles if missing in the raw data. |
| MAF | Minor allele frequency, (0,0.5] |
| EAF | Effective allele frequency, (0,0.5] |
| EA | Effective allele, exclude the summary data if the effective allele is not apparent. |
| NEA | Non-effective allele, extract from 1000G if only effective allele is given in the raw data. |
| BETA | Effect size, if odds ratio is given, use ln(odds ratio) |
| SE | Standard error, estimated by p-value, sample size, and beta if missing. |
| P | GWAS original p-value, (0,1) |
| Zscore | equals to BETA/SE |
Other filtration:
- If ‘INFO’ was available in the raw data, the variants with INFO < 0.9 were filtered out.
- If Zscore and SE were unavailable, we calculated Zscore using a quantile function and then calculated SE by BETA and Zscore.
Fine-mapping pipeline
We performed fine-mapping for every causal block by three approaches: LD-free, LD-based, and function-informed fine-mapping.
LD block partition
To perform fine-mapping on curated GWAS summary statistics, we partitioned the genetic variants with relatively independent LD blocks estimated using LDetect. We checked each file and extracted the variants in LD blocks (termed causal blocks) that had at least one genome-wide significant variant (P-value ≤ 5E−8). The GWAS summary information for each causal block was then reformatted into the format required by the fine-mapping tools.
Independent signals identification (New)
We identified independently associated loci for each study using GCTA-COJO. We considered a locus independently associated if marginal and conditional P values were < 5e-8. We produced a set of summary statistics for each independent locus conditional on all other lead SNP in the same block.
Fine-mapping tools running
For every independent signal, we perform fine-mapping in three schemas: LD-free, LD-based, and function-informed. See below for details. We assumed that there was only one causal variant in an LD block and used the recommended parameters of the tools.
-
LD-free fine-mapping (New)
-
abf
we computed approximate Bayes factors (BFs) from the BETA and SE for each SNP, with a variance prior (W of 0.15 for quantitative traits and 0.2 for binary traits, and determined variant PPs assuming a single causal variant as PP = SNP_BF/sum(all SNP BFs) for all SNPs within a block.
-
-
LD-based fine-mapping (Updated)
-
FINEMAP
We used
--sss(shotgun stochastic search) function of FINEMAP with--n-causal-snps 1. Additionally, FIENMAP requires MAF of variants. When the MAF is unavailable in the original file, we use the data in the reference panel. -
PAINTOR
PAINTOR was run with
-enumerate 1, which means a maximum number of allowed causal SNPs. Since PAINTOR integrates fine-mapping with a complex annotation in numerous such data, we set annotations of each variant as 1. -
CAVIARBF
Firstly, we calculated Bayes Factors using
caviarbf -t 0 -a 0.1281429 -c 1as commended in CAVIARBF’s manual. Then we usedmodel_searchto search models and compute posterior probabilities. -
SuSiE
We used
susie_rssfunction in SuSiE package. We set the parameterLfor the number of causal variants to 1.
-
-
Function-informed fine-mapping (New)
-
Polyfun+FINEMAP and Polyfun+SuSiE
We conduct function-informed fine-mapping by feeding the prior causal probabilities estimated by PolyFun to FINEMAP or SuSiE.
-
Post-fine-mapping QC
Because some human genetic variants in 1KGP are incomplete, there are variants without any LD information in some GWASs, which may markedly affect causal variant estimation in the fine-mapping process. Thus, to avoid overestimating causality for such variants, we excluded them (P > 5E−5) from the credible set but still allowed users to inspect the original summary statistics. Also, we set the default PP value to −1 for variants without LD information.
Custom fine-mapping procedure (New)
In CAUSALdb, we provided processed credible sets by a well-designed pipeline but with default parameters and fixed blocks. For users who want to perform fine-mapping with their data or custom parameters, for example, not using LD blocks as boundaries of loci, we developed a tool called easyfinemap. Easyfinemap can help users with summary statistics standardization, LD estimation, independent loci identification, and posterior probability calculation. Easyfinemap is open-sourced at https://github.com/Jianhua-Wang/easyfinemap/tree/main.
Links
Ldetect: https://bitbucket.org/nygcresearch/ldetect/src/master/
FINEMAP: http://www.christianbenner.com/
PAINTOR: https://github.com/gkichaev/PAINTOR_V3.0
CAVIARBF: https://bitbucket.org/Wenan/caviarbf/src/default/
SuSiE: https://stephenslab.github.io/susieR/articles/finemapping.html
MeSH: https://meshb-prev.nlm.nih.gov/search
1000GP: http://www.internationalgenome.org/
TOPMED: https://topmed.nhlbi.nih.gov
GWAS resources
LD hub: http://ldsc.broadinstitute.org/ldhub/
GRASP: https://grasp.nhlbi.nih.gov/FullResults.aspx
GWAS Catalog: https://www.ebi.ac.uk/gwas/downloads/summary-statistics
PhenoScanner: http://www.phenoscanner.medschl.cam.ac.uk/data/
dbGaP: ftp://ftp.ncbi.nlm.nih.gov/dbgap/studies/
Gene ATLAS: http://geneatlas.roslin.ed.ac.uk/
GWAS ATLAS: https://atlas.ctglab.nl/
Neale Lab UKBB: https://docs.google.com/spreadsheets/d/1kvPoupSzsSFBNSztMzl04xMoSC3Kcx3CrjVf4yBmESU/edit#gid=227859291
Pan-UKBB: https://pan.ukbb.broadinstitute.org/downloads
MRbase: https://gwas.mrcieu.ac.uk/datasets/
FinnGen: https://finngen.gitbook.io//causaldb/static/md/v/r9/data-download